
ETF Tracker StatSheet
You can view the latest version here.
RECORDS ROLL ON, BUT THE FOUNDATION LOOKS THINNER
[Chart courtesy of MarketWatch.com]
- Moving the market
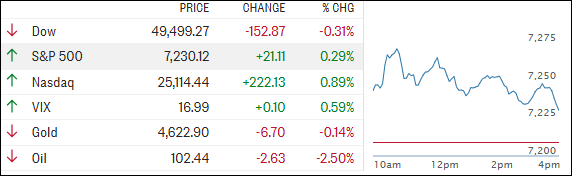
The S&P 500 pushed to a fresh intraday record high on Friday, getting a big lift from Apple, while oil prices moved lower as a new trading month kicked off.
Apple shares jumped more than 5% after the company delivered a solid fiscal second‑quarter earnings and revenue beat.
Even better, its outlook for the current quarter topped expectations, easily outweighing some lingering disappointment around iPhone sales, which fell short of estimates for the second time in three quarters.
On the other side of the ledger, oil prices slid after reports that Iran sent its response—via Pakistani mediators—to the latest U.S. revisions of a draft agreement aimed at ending the Middle East conflict.
West Texas Intermediate crude fell roughly 4%, trading near the $100‑a‑barrel mark.
Today’s moves followed a record‑setting session the day before, when the S&P 500 closed above 7,200 for the first time ever. That milestone helped both the S&P 500 and Nasdaq lock in their strongest monthly performances since 2020, while the Dow logged its best month since November 2024.
Strong first‑quarter earnings and hopes for easing tensions in the Middle East have powered stocks higher this year. Even after the initial dip when the U.S. war with Iran began, all three major indexes are now trading comfortably above where they started 2026.
By the close, the S&P 500 once again flexed its strength, finishing at a fresh record high—despite another day of brutal negative breadth. In fact, this marked the fourth record high in the past five sessions where decliners (320) far outnumbered advancers (180), highlighting just how narrow this rally has become.
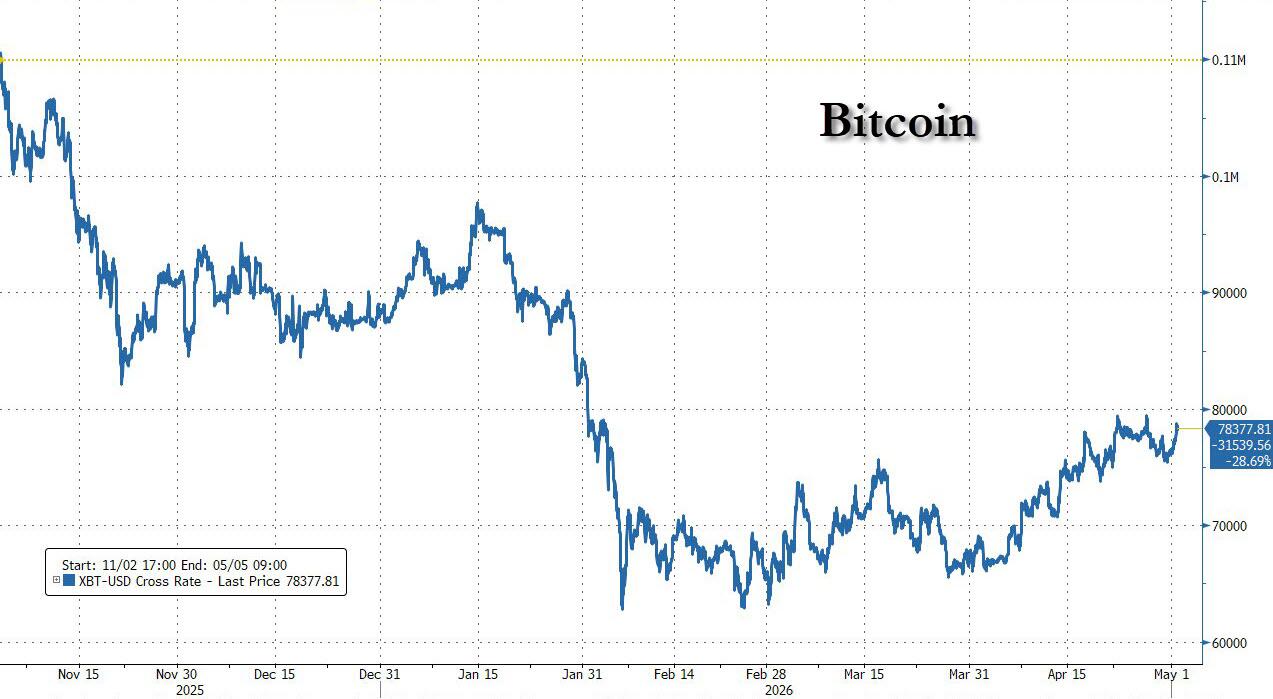
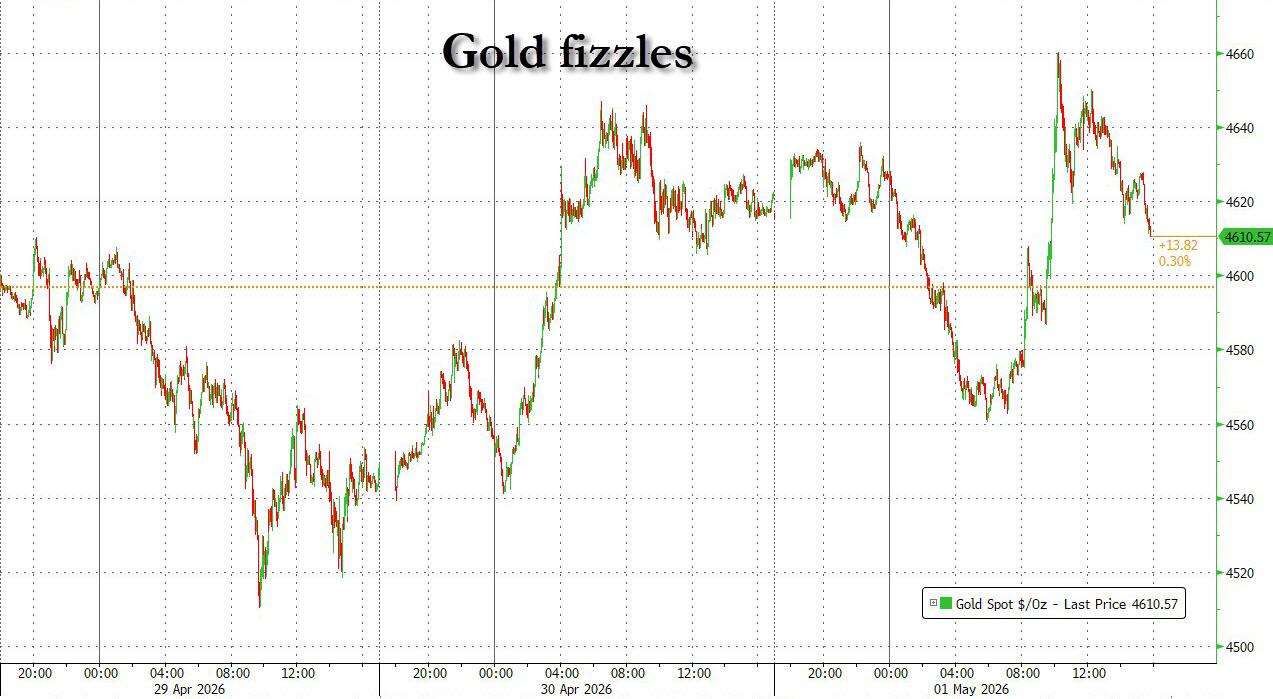
Bitcoin climbed back above $78,000 to notch a new post‑January high, while gold briefly popped midday before fading back to roughly unchanged. As ZeroHedge noted, gold’s stagflationary signal may still be coming—it’s just not being heard yet.
The peak of earnings season is now behind us, with only about 10% of the S&P 500 set to report next week.
As some near‑term catalysts fade, markets may soon be left to grapple with lingering stagflation risks and a deteriorating geopolitical backdrop—so the question is:
Can this rally keep pushing higher with fewer tailwinds and growing uncertainty?
2. Current domestic “Buy” Cycle (effective 5/20/2025); International “Buy” Cycle (effective 5/8/25)
Our domestic bullish cycle that began on November 21, 2023, concluded on April 3, 2025, following a market downturn triggered by President Trump’s tariff policy announcement.
This development caused significant declines across major indexes and broader market indices. However, markets subsequently rebounded, culminating in a new domestic “Buy” signal taking effect May 20, 2025.
Concurrently, our International Trend Tracking Index (TTI) experienced parallel volatility. On April 4, 2025, it breached critical thresholds, prompting a “Sell” recommendation. This position reversed as global markets recovered, with the International TTI regaining sufficient momentum to issue a new “Buy” signal effective May 8, 2025.
3. Trend Tracking Indexes (TTIs)
The major indexes all opened higher, but only the S&P 500 and Nasdaq managed to hang on to their early gains.
The Dow slipped modestly into the red, giving the session a mixed feel overall. Metals were split as well, and our TTIs reflected that same indecision.
The international TTI mostly treaded water, while the domestic TTI edged slightly lower—nothing meaningful enough to change the bigger picture. The primary trend remains intact, with markets simply marking time rather than signaling a shift in direction.
This is how we closed 05/01/2026:
Domestic TTI: +5.59% above its M/A (prior close +6.25%)—Buy signal effective 5/20/25.
International TTI: +8.17% above its M/A (prior close +8.69%)—Buy signal effective 5/8/25.
All linked charts above are courtesy of Bloomberg via ZeroHedge.
———————————————————-
WOULD YOU LIKE TO HAVE YOUR INVESTMENTS PROFESSIONALLY MANAGED?
Do you have the time to follow our investment plans yourself? If you are a busy professional who would like to have his portfolio managed using our methodology, please contact me directly to get more details.
Contact Ulli