
- Moving the markets
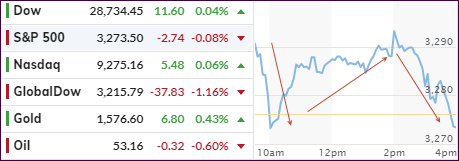
In the end, today was nothing but one gigantic roller coaster ride, as an early rally lost steam, then found some fresh upward momentum, which was all given back at the close.
Maybe the early pump was the result of Apple’s blow-out earnings announced yesterday after the close, but it sure had no staying power with worldwide markets, as represented by the Global Dow, suffering as well.
In the meantime, the coronavirus deaths are spiraling higher with new cases being reported every day. Even Fed chair Powell, after leaving interest rates unchanged, commented that they are monitoring the effects of the virus and its potential for disrupting the global economy:
“It’s a serious issue. There is likely to be some disruption of activity in China and probably globally,” he told reporters, unprompted, in a news conference after the central bank’s first rate-setting meeting of the year. “We’ll just have to wait to see what the effect is globally.”
These virus issues are sure to stay with us for a while with the unanswered question remaining: Will the potential fallout be severe enough to unravel this bullish trend? It’s possible, since it does not look like the contagion can be contained within a short period of time.
2. ETFs in the Spotlight
In case you missed the announcement and description of this section, you can again.
It features 10 broadly diversified and sector ETFs from my HighVolume list as posted every Saturday. Furthermore, they are screened for the lowest MaxDD% number meaning they have been showing better resistance to temporary sell offs than all others over the past year.
The below table simply demonstrates the magnitude with which some of the ETFs are fluctuating regarding their positions above or below their respective individual trend lines (%+/-M/A). A break below, represented by a negative number, shows weakness, while a break above, represented by a positive percentage, shows strength.
For hundreds of ETF choices, be sure to reference Thursday’s StatSheet.
For this current domestic “Buy” cycle, here’s how some our candidates have fared:
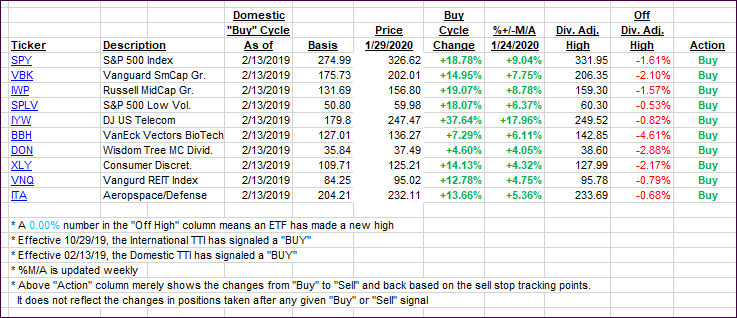
Click image to enlarge
Again, the %+/-M/A column above shows the position of the various ETFs in relation to their respective long-term trend lines, while the trailing sell stops are being tracked in the “Off High” column. The “Action” column will signal a “Sell” once the -8% point has been taken out in the “Off High” column. For more volatile sector ETFs, the trigger point is -10%.
3. Trend Tracking Indexes (TTIs)
Our Trend Tracking Indexes (TTIs) ended the session mixed with the major indexes ending close to the unchanged line.
Here’s how we closed 01/29/2020:
Domestic TTI: +6.51% above its M/A (prior close +6.85%)—Buy signal effective 02/13/2019
International TTI: +4.37% above its M/A (prior close +4.42%)—Buy signal effective 10/29/2019
Disclosure: I am obliged to inform you that I, as well as my advisory clients, own some of the ETFs listed in the above table. Furthermore, they do not represent a specific investment recommendation for you, they merely show which ETFs from the universe I track are falling within the specified guidelines.
Contact Ulli