
- Moving the markets
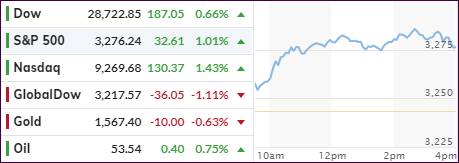
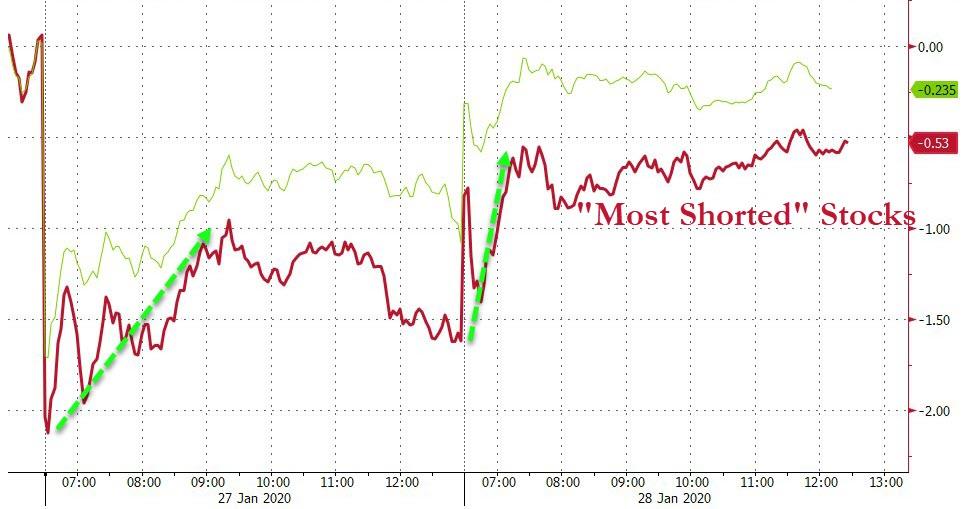
Despite coming off the intra-day highs at the close, the major indexes managed to climb out of hole, and close in the green for the first time in the past three trading sessions, although a major short-squeeze gave an assist in that effort.
Coronavirus fears subsided a little, as China appears to have taken serious actions much faster than a few years ago, when the SARS virus in 2003 created a mortality risk of +10%, while the current outbreak lies in the 2-3% area.
The focus also returned to the earnings season with Apple being on deck after today’s close. Companies are beating estimates by 5% so far, the best beat rate since 1Q19, according to MarketWatch.
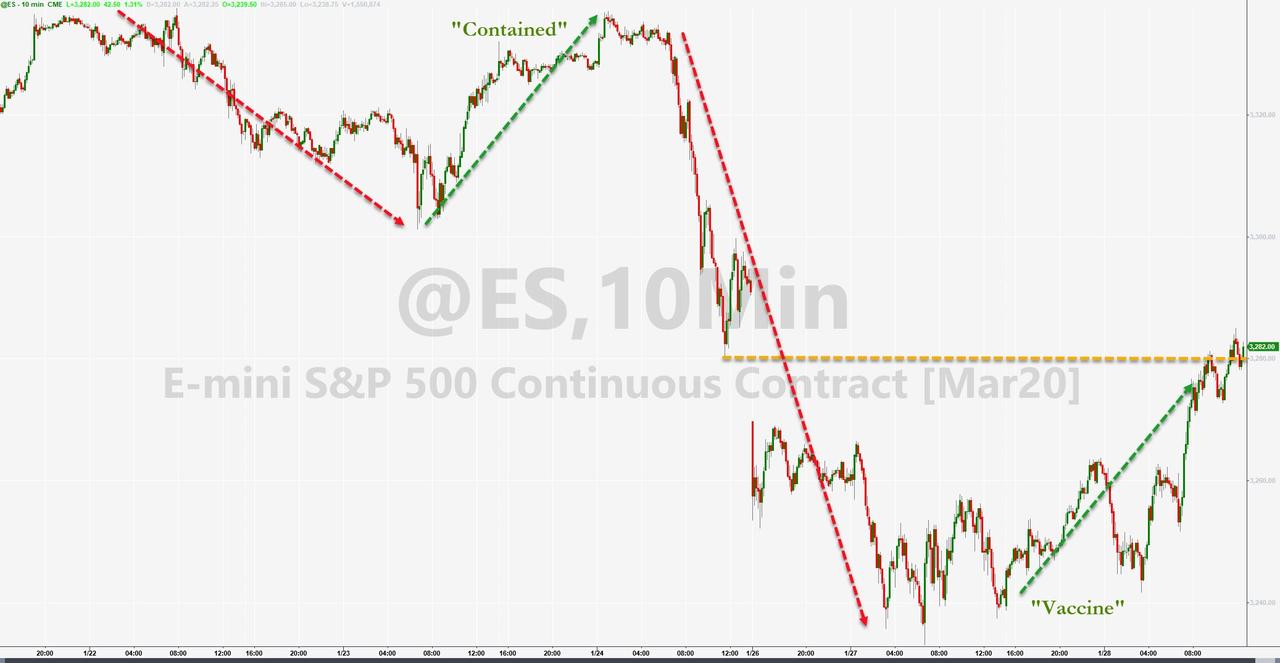
Some headline chatter, that a vaccine was being produced in Hon Kong, was the original catalyst to get the bulls back on track, but who knows how much truth there was to that story. However, ZH pointed out correctly that “waiting at least four months for any vaccine will not stop a collapse in global supply chains, if this virus continues to spread like it is.”
That simply means, we must remain vigilant and be prepared that a major directional change remains a possibility.
2. ETFs in the Spotlight
In case you missed the announcement and description of this section, you can again.
It features 10 broadly diversified and sector ETFs from my HighVolume list as posted every Saturday. Furthermore, they are screened for the lowest MaxDD% number meaning they have been showing better resistance to temporary sell offs than all others over the past year.
The below table simply demonstrates the magnitude with which some of the ETFs are fluctuating regarding their positions above or below their respective individual trend lines (%+/-M/A). A break below, represented by a negative number, shows weakness, while a break above, represented by a positive percentage, shows strength.
For hundreds of ETF choices, be sure to reference Thursday’s StatSheet.
For this current domestic “Buy” cycle, here’s how some our candidates have fared:
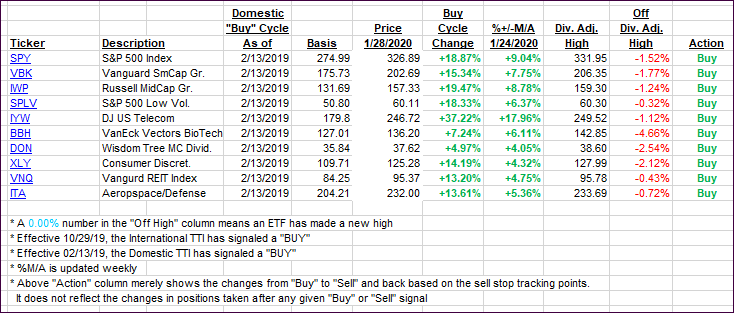
Click image to enlarge
Again, the %+/-M/A column above shows the position of the various ETFs in relation to their respective long-term trend lines, while the trailing sell stops are being tracked in the “Off High” column. The “Action” column will signal a “Sell” once the -8% point has been taken out in the “Off High” column. For more volatile sector ETFs, the trigger point is -10%.
3. Trend Tracking Indexes (TTIs)
Our Trend Tracking Indexes (TTIs) both recovered as traders considered yesterday’s sell-off overdone.
Here’s how we closed 01/28/2020:
Domestic TTI: +6.85% above its M/A (prior close +5.86%)—Buy signal effective 02/13/2019
International TTI: +4.42% above its M/A (prior close +3.84%)—Buy signal effective 10/29/2019
Disclosure: I am obliged to inform you that I, as well as my advisory clients, own some of the ETFs listed in the above table. Furthermore, they do not represent a specific investment recommendation for you, they merely show which ETFs from the universe I track are falling within the specified guidelines.
Contact Ulli