
ETF Tracker StatSheet
You can view the latest version here.
CLOSING A SOLID WEEK WITH A STRONG FINISH
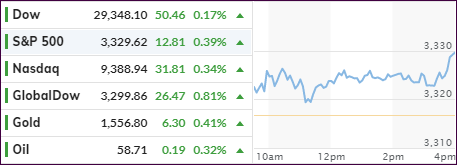
- Moving the markets
The record setting pace continued with all major indexes scoring impressive gains. The S&P 500 managed to add almost 2% in the past five trading days alone and has traded now 70 straight days without a 1% loss.
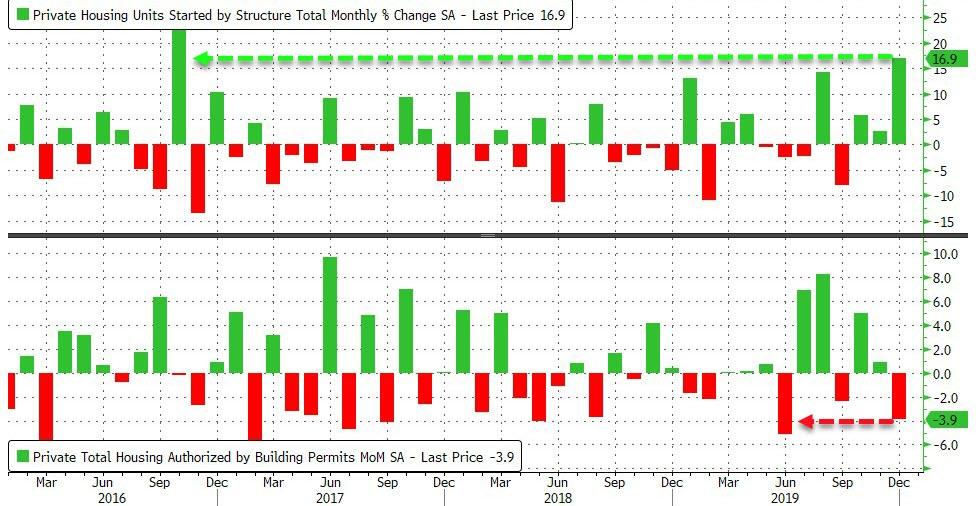
While some econ numbers were less than impressive, Housing Starts surged 16.9% MoM to the their highest since 2006, despite a sharp drop in Permits, which shrank -3.9% MoM, far worse than the -1.5% expected.
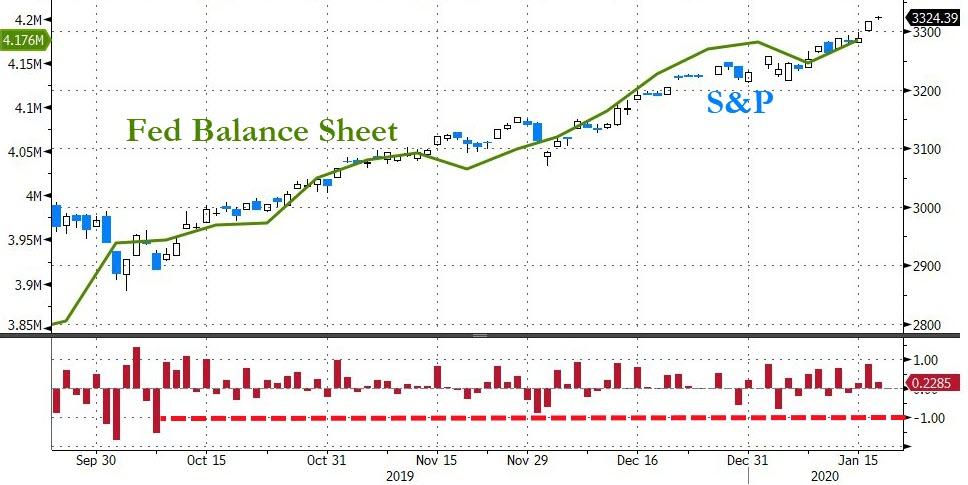
Wall Street simply remains in rally mode with weak data being ignored, and strong ones being used to boost stocks to ever higher levels. Regarding the above housing numbers, it’s important to note that they are one of the more critical metrics used to evaluate the health of the economy, while the Fed’s low interest rate policy keeps the buying interest up.
Sure, as ZH pointed out correctly, stocks have reached most expensive and most overbought levels, which even surpass the DotCom bubble. This is a bull market on steroids thanks to the loose Central Bank policies, as I have pointed out before.
We’re overdue for a correction, but this being an election year, whatever the powers to be can do will be done to keep the markets elevated. After all, when it comes time to cast your vote, you will vote based on how you feel about the economic circumstances.
Right now, the markets give the feeling of being one giant party; and we will dance along but stay as close to the exit doors as we can.
2. ETFs in the Spotlight
In case you missed the announcement and description of this section, you can again.
It features 10 broadly diversified and sector ETFs from my HighVolume list as posted every Saturday. Furthermore, they are screened for the lowest MaxDD% number meaning they have been showing better resistance to temporary sell offs than all others over the past year.
The below table simply demonstrates the magnitude with which some of the ETFs are fluctuating regarding their positions above or below their respective individual trend lines (%+/-M/A). A break below, represented by a negative number, shows weakness, while a break above, represented by a positive percentage, shows strength.
For hundreds of ETF choices, be sure to reference Thursday’s StatSheet.
For this current domestic “Buy” cycle, here’s how some our candidates have fared:
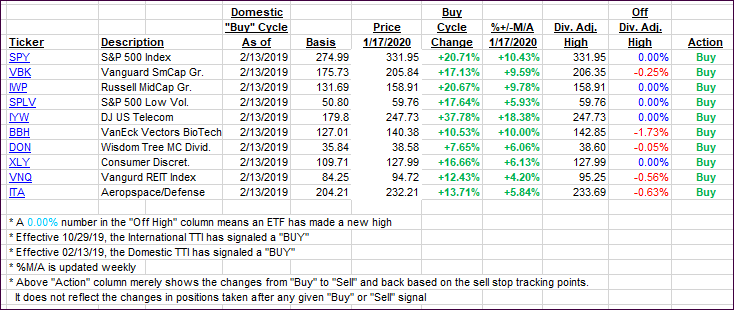
Again, the %+/-M/A column above shows the position of the various ETFs in relation to their respective long-term trend lines, while the trailing sell stops are being tracked in the “Off High” column. The “Action” column will signal a “Sell” once the -8% point has been taken out in the “Off High” column. For more volatile sector ETFs, the trigger point is -10%.
3. Trend Tracking Indexes (TTIs)
Our Trend Tracking Indexes (TTIs) showed a mixed picture with the International one playing catch up.
Here’s how we closed 01/17/2020:
Domestic TTI: +9.37% above its M/A (prior close +9.49%)—Buy signal effective 02/13/2019
International TTI: +7.24% above its M/A (prior close +6.93%)—Buy signal effective 10/29/2019
Disclosure: I am obliged to inform you that I, as well as my advisory clients, own some of the ETFs listed in the above table. Furthermore, they do not represent a specific investment recommendation for you, they merely show which ETFs from the universe I track are falling within the specified guidelines.
———————————————————-
WOULD YOU LIKE TO HAVE YOUR INVESTMENTS PROFESSIONALLY MANAGED?
Do you have the time to follow our investment plans yourself? If you are a busy professional who would like to have his portfolio managed using our methodology, please contact me directly or get more details here.
———————————————————
Back issues of the ETF Tracker are available on the web.
Contact Ulli