
- Moving the markets
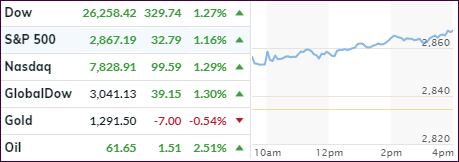
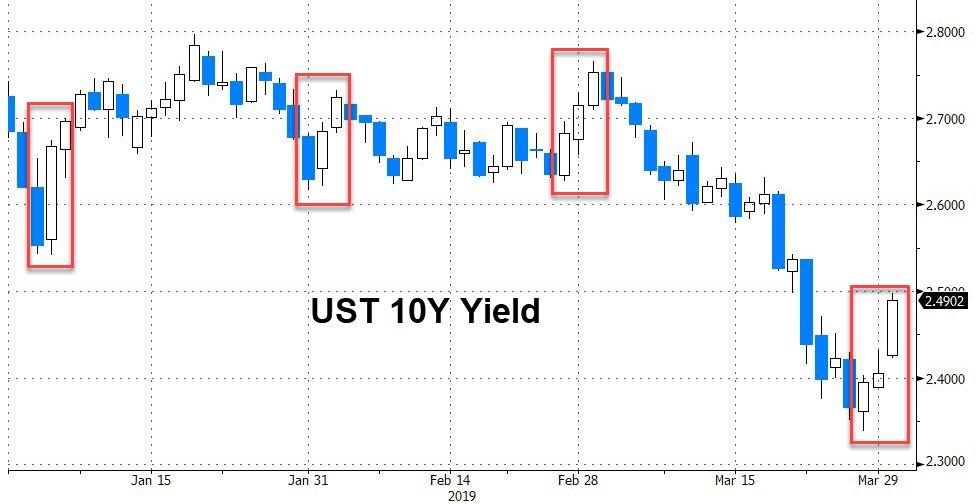
After closing out March on a positive note, April started with a bang, as the major indexes sported gains above 1%. The only fly in the ointment was a sharp spike in interest rates with the 10-bond shooting up almost 11 basis points to close at 2.5%, which kept the conservative ETFs in our portfolios lagging the indexes for the session.
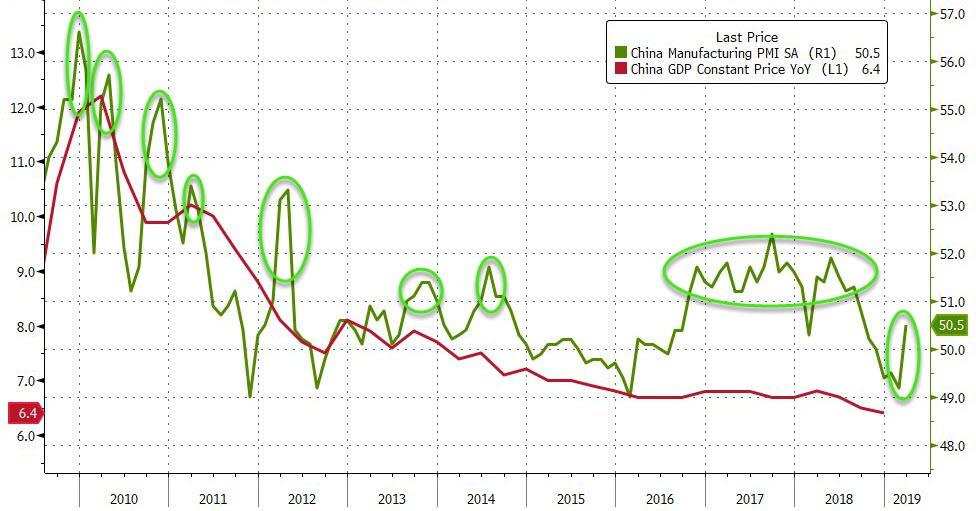
The rally was a global one supported by an allegedly improved PMI in China, which showed its first expansion in 5 months supporting the narrative that global headwinds are over and Chinese optimism is warranted and now has replaced the U.S.-China trade talk euphoria. We’ve seen these “green shoots” in the recent past, as ZH pointed out, and all ended up being of short duration.
Of course, traders conveniently forgot that the Chinese a long time ago announced that econ data are “for reference” only, which probably means that they are carefully “goal-seeked” and supported by political motivation.
On the other side of the globe, the eurozone’s manufacturing index continued to struggle and remains in contraction territory. Here in the U.S., retail sales figures disappointed as reports showed that the tapped-out consumer spent 0.2% less in February than in January, showing a trend towards thriftiness, which economists expect to affect economic growth numbers in the first quarter.
For status of our Trend Tracking Indexes (TTIs), this was good day with both of them jumping deeper into bullish territory (section 3).
- ETFs in the Spotlight
In case you missed the announcement and description of this section, you can read it here again.
It features 10 broadly diversified and sector ETFs from my HighVolume list as posted every Saturday. Furthermore, they are screened for the lowest MaxDD% number meaning they have been showing better resistance to temporary sell offs than all others over the past year.
The below table simply demonstrates the magnitude with which some of the ETFs are fluctuating regarding their positions above or below their respective individual trend lines (%+/-M/A). A break below, represented by a negative number, shows weakness, while a break above, represented by a positive percentage, shows strength.
For hundreds of ETF choices, be sure to reference Thursday’s StatSheet.
For this current domestic “Buy” cycle, here’s how some our candidates have fared:
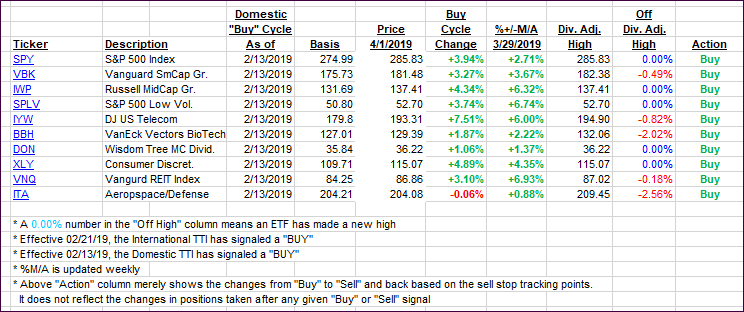
Again, the %+/-M/A column above shows the position of the various ETFs in relation to their respective long-term trend lines, while the trailing sell stops are being tracked in the “Off High” column. The “Action” column will signal a “Sell” once the -8% point has been taken out in the “Off High” column. For more volatile sector ETFs, the trigger point is -10%.
- Trend Tracking Indexes (TTIs)
Our Trend Tracking Indexes (TTIs) jumped as global bullishness due to improved Chinese manufacturing numbers.
Here’s how we closed 04/01/2019:
Domestic TTI: +4.92% above its M/A (last close +3.60%)—Buy signal effective 02/13/2019
International TTI: +2.59% above its M/A (last close +1.23%)—Buy signal effective 02/21/2019
Disclosure: I am obliged to inform you that I, as well as my advisory clients, own some of the ETFs listed in the above table. Furthermore, they do not represent a specific investment recommendation for you, they merely show which ETFs from the universe I track are falling within the specified guidelines.
Contact Ulli