
- Moving the markets
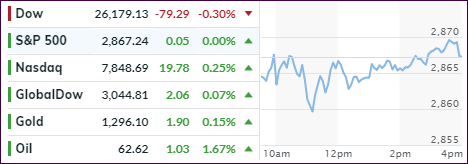
After rallying the past four trading days, it was time to take a breather with the major indexes traveling aimlessly around their respective trend lines. The S&P 500 closed unchanged, the Dow dropped -0.30%, while the Nasdaq managed to squeeze out +0.25%.
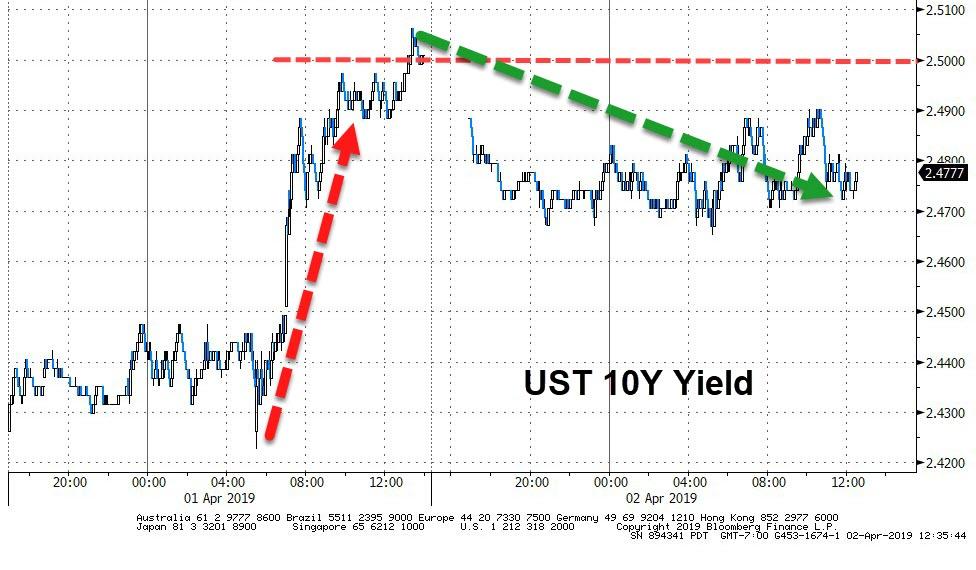
Bonds were on the mend with the 10-year yield dropping backing below 2.5% level to close at 2.472%. More importantly, the yield curve corrected and is no longer inverted, meaning that the 10-year bond now yields more than the 3-month one.
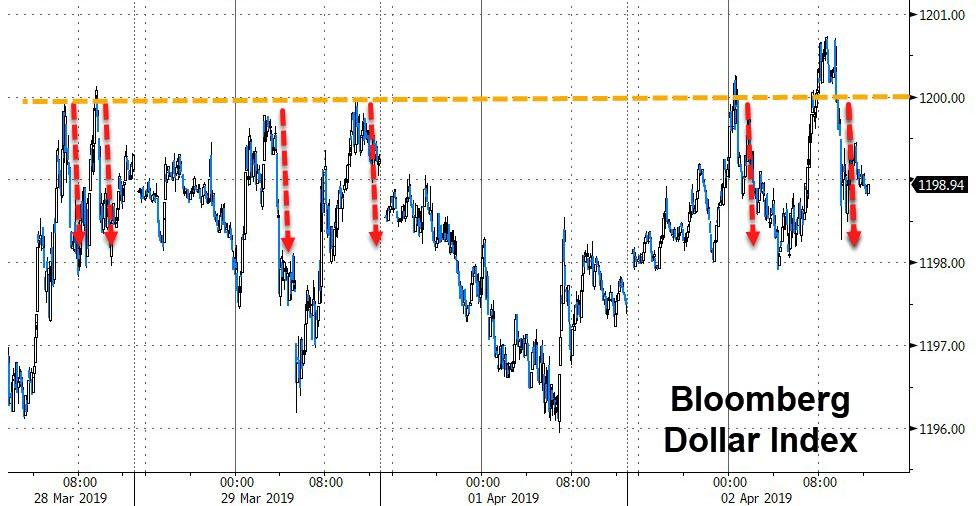
The U.S. Dollar index round-tripped, broke above the crucial 1,200 level twice but reversed to close lower. A day of consolidation best describes this session, which had not much effect on the direction of our Trend Tracking Indexes (TTIs).
- ETFs in the Spotlight
In case you missed the announcement and description of this section, you can read it here again.
It features 10 broadly diversified and sector ETFs from my HighVolume list as posted every Saturday. Furthermore, they are screened for the lowest MaxDD% number meaning they have been showing better resistance to temporary sell offs than all others over the past year.
The below table simply demonstrates the magnitude with which some of the ETFs are fluctuating regarding their positions above or below their respective individual trend lines (%+/-M/A). A break below, represented by a negative number, shows weakness, while a break above, represented by a positive percentage, shows strength.
For hundreds of ETF choices, be sure to reference Thursday’s StatSheet.
For this current domestic “Buy” cycle, here’s how some our candidates have fared:
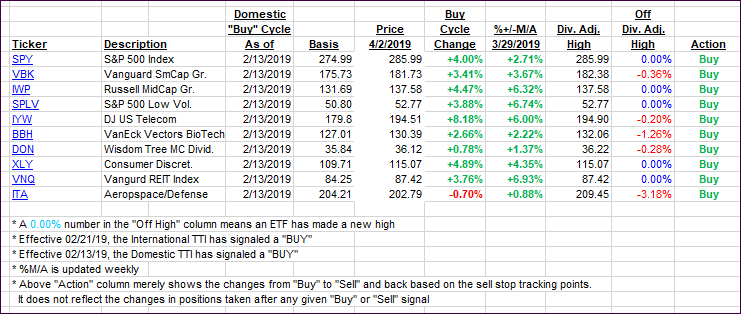
Again, the %+/-M/A column above shows the position of the various ETFs in relation to their respective long-term trend lines, while the trailing sell stops are being tracked in the “Off High” column. The “Action” column will signal a “Sell” once the -8% point has been taken out in the “Off High” column. For more volatile sector ETFs, the trigger point is -10%.
- Trend Tracking Indexes (TTIs)
Our Trend Tracking Indexes (TTIs) were mixed with the domestic one slipping a tad, while the international one gained.
Here’s how we closed 04/02/2019:
Domestic TTI: +4.84% above its M/A (last close +4.92%)—Buy signal effective 02/13/2019
International TTI: +2.71% above its M/A (last close +2.59%)—Buy signal effective 02/21/2019
Disclosure: I am obliged to inform you that I, as well as my advisory clients, own some of the ETFs listed in the above table. Furthermore, they do not represent a specific investment recommendation for you, they merely show which ETFs from the universe I track are falling within the specified guidelines.
Contact Ulli