
- Moving the markets
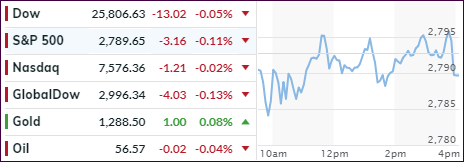
Aimless meandering probably best describes today’s session during which traders looked in vain for catalysts to establish market direction. There were none, so we bounced around the unchanged line in a narrow range, as neither bulls nor bears could find some footing.
In the end, the major indexes closed slightly in the red; not a bad result considering the violent moves we witnessed yesterday. While some reports noted that a trade solution between the U.S. and China maybe close, there was no market reaction. This makes me think that this type of news may already have been priced in.
It looks like a new driver is needed to attempt another breakthrough of the S&P’s 2,800 level, since it seems that trade optimism has taken us as far as it could. As I posted before, this was the 4th attempt over the past few months with 3 of them having been rebuffed and ended with a sell-off.
We’ll have to wait and see if “it’s different this time,” otherwise the bears might be able to gain the upper hand—again.
- ETFs in the Spotlight
In case you missed the announcement and description of this section, you can read it here again.
It features 10 broadly diversified and sector ETFs from my HighVolume list as posted every Saturday. Furthermore, they are screened for the lowest MaxDD% number meaning they have been showing better resistance to temporary sell offs than all others over the past year.
The below table simply demonstrates the magnitude with which some of the ETFs are fluctuating regarding their positions above or below their respective individual trend lines (%M/A). A break below, represented by a negative number, shows weakness, while a break above, represented by a positive percentage, shows strength.
For hundreds of ETF choices, be sure to reference Thursday’s StatSheet.
Year to date, here’s how some our current candidates for this current ‘Buy’ cycle have fared:
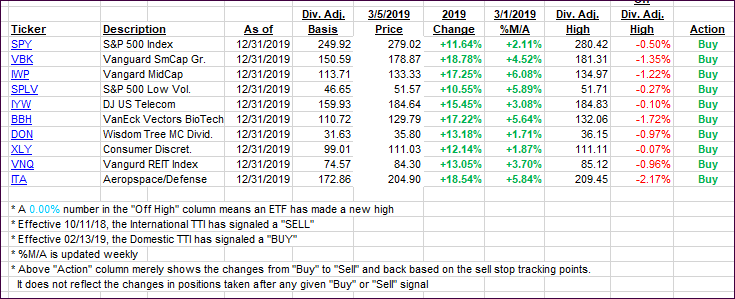
Again, the %M/A column above shows the position of the various ETFs in relation to their respective long-term trend lines, while the trailing sell stops are being tracked in the “Off High” column. The “Action” column will signal a “Sell” once the -8% point has been taken out in the “Off High” column. For more volatile sector ETFs, the trigger point is -10%.
- Trend Tracking Indexes (TTIs)
Our Trend Tracking Indexes (TTIs) pulled back as equities were stuck in a sideways pattern.
Here’s how we closed 03/05/2019:
Domestic TTI: +2.78% above its M/A (last close +3.10%)—Buy signal effective 02/13/2019
International TTI: +0.97% above its M/A (last close +1.16%)—Buy signal effective 02/21/2019
Disclosure: I am obliged to inform you that I, as well as my advisory clients, own some of the ETFs listed in the above table. Furthermore, they do not represent a specific investment recommendation for you, they merely show which ETFs from the universe I track are falling within the specified guidelines.
Contact Ulli