
- Moving the markets
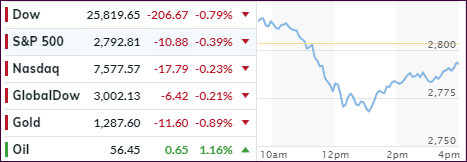
Sure, eventually there had to be a market pullback, as only hype and euphoria surrounded the U.S.-China trade talks with hard evidence of progress still seeming to be nebulous. This is what we saw today, as optimism about a concrete resolution simply faded.
An early rally vanished in a hurry with the Dow sinking at one point over 450 points, before a slow and steady comeback sharply limited early losses. I took the opportunity to add some sector ETFs to our holdings, as the major indexes were hovering deeply in the red.
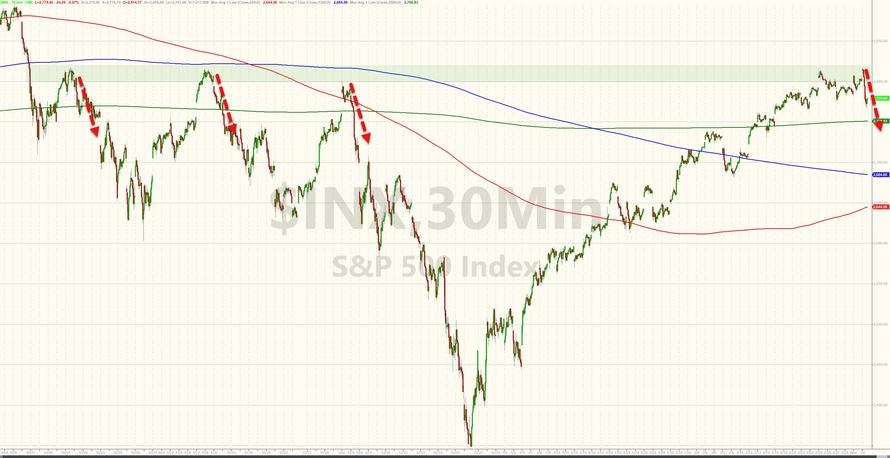
The S&P 500 surrendered its hard fought for 2,800 level but only closed 8 points below it. However, more importantly, the index was threatening to break below its 200-day M/A, now seen as a support level, but it managed to reverse course and close safely, at least for the time being, above it by ~1.5%, as the afternoon bounce-back came to the rescue.
At this point, the S&P 500 is stuck in a quadruple top formation, and it is critical for this index to not only to regain its 2,800 marker but also to create further upside momentum. Otherwise, we might see a repeat downside performance, as shown by the previous 3 attempts, of which the third one was the most devastating, which led to the disastrous Q4 2018.
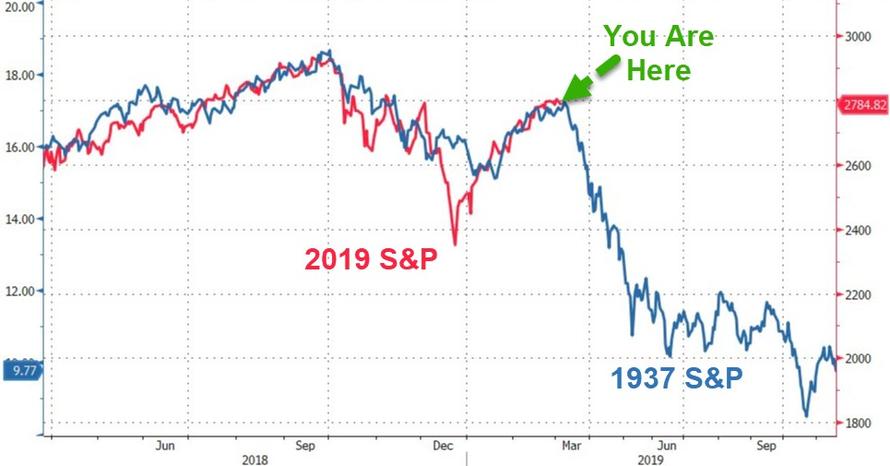
A variety of analysts and newsletters like ZH present this chart from time to time to serve as a reminder of where we might be and what could occur. Look at it and notice how close we are of repeating history.
Will it happen again? Who knows, but I feel that it is imperative to have an exit strategy in place, just in case a similar outcome sneaks up on us with the potential to absolutely pillage investment portfolios. After all, economic realities are far detached from current elevated equity levels.
- ETFs in the Spotlight
In case you missed the announcement and description of this section, you can read it here again.
It features 10 broadly diversified and sector ETFs from my HighVolume list as posted every Saturday. Furthermore, they are screened for the lowest MaxDD% number meaning they have been showing better resistance to temporary sell offs than all others over the past year.
The below table simply demonstrates the magnitude with which some of the ETFs are fluctuating regarding their positions above or below their respective individual trend lines (%M/A). A break below, represented by a negative number, shows weakness, while a break above, represented by a positive percentage, shows strength.
For hundreds of ETF choices, be sure to reference Thursday’s StatSheet.
Year to date, here’s how some our current candidates for this current ‘Buy’ cycle have fared:
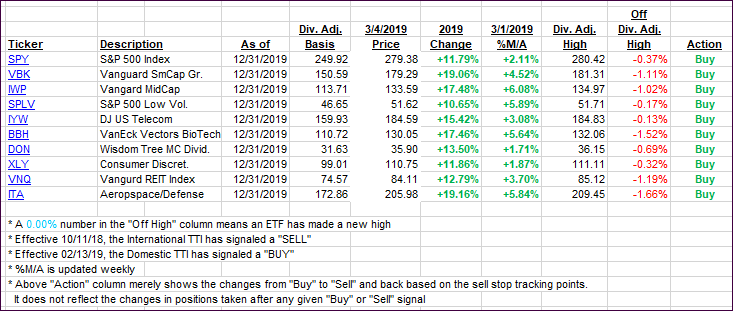
Again, the %M/A column above shows the position of the various ETFs in relation to their respective long-term trend lines, while the trailing sell stops are being tracked in the “Off High” column. The “Action” column will signal a “Sell” once the -8% point has been taken out in the “Off High” column. For more volatile sector ETFs, the trigger point is -10%.
- Trend Tracking Indexes (TTIs)
Our Trend Tracking Indexes (TTIs) slipped but remain on the bullish side of their respective trend lines.
Here’s how we closed 03/04/2019:
Domestic TTI: +3.10% above its M/A (last close +3.59%)—Buy signal effective 02/13/2019
International TTI: +1.16% above its M/A (last close +1.30%)—Buy signal effective 02/21/2019
Disclosure: I am obliged to inform you that I, as well as my advisory clients, own some of the ETFs listed in the above table. Furthermore, they do not represent a specific investment recommendation for you, they merely show which ETFs from the universe I track are falling within the specified guidelines.
Contact Ulli