
- Moving the markets
Not even poor earnings by Harley-Davidson, which dropped some 5%, as well as a collapse in consumer sentiment, with both current and future expectations plunging, could get the attention of Wall Street Traders.
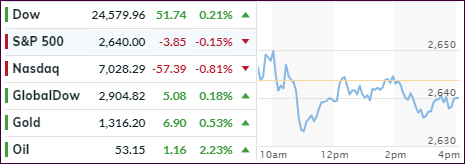
As a result, the major indexes struggled for direction with the Dow eking out a small gain, while the Nasdaq led to the downside by surrendering -0.81%.
There was one thing, and one thing only that mattered and that was the answer to “what will the Fed do?” when it concludes its monthly meeting on interest rates to be released late morning tomorrow. Speculation ran rampant, and several analysts projected the outcome for the markets to be negative, despite Fed head Powell’s recent U-turn into dovish territory.
Of course, nobody knows for sure, but the pre-programmed computer algos will be the first ones to arrive at a conclusion and can push the markets in either direction, depending on their interpretation of the news headline.
It promises to be an interesting session.
- ETFs in the Spotlight
In case you missed the announcement and description of this section, you can read it here again.
It features 10 broadly diversified and sector ETFs from my HighVolume list as posted every Saturday. Furthermore, they are screened for the lowest MaxDD% number meaning they have been showing better resistance to temporary sell offs than all others over the past year.
The below table simply demonstrates the magnitude with which some of the ETFs are fluctuating regarding their positions above or below their respective individual trend lines (%M/A). A break below, represented by a negative number, shows weakness, while a break above, represented by a positive percentage, shows strength.
For hundreds of ETF choices, be sure to reference Thursday’s StatSheet.
Year to date, here’s how our original candidates from the last cycle have fared:
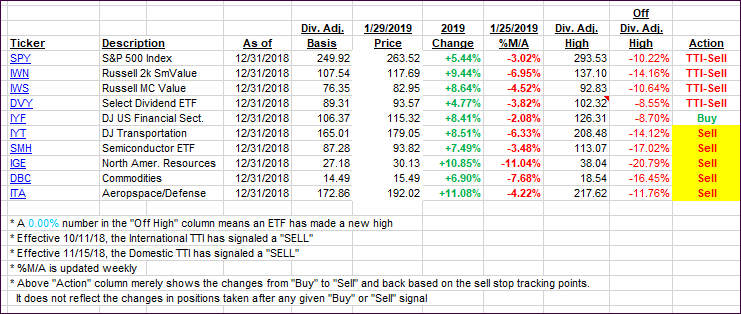
Again, the %M/A column above shows the position of the various ETFs in relation to their respective long-term trend lines, while the trailing sell stops are being tracked in the “Off High” column. The “Action” column will signal a “Sell” once the -8% point has been taken out in the “Off High” column. For more volatile sector ETFs, the trigger point is -10%.
- Trend Tracking Indexes (TTIs)
Our Trend Tracking Indexes (TTIs) changed only a tad as the major indexes were stuck in a sideways pattern.
Here’s how we closed 01/29/2019:
Domestic TTI: -2.07% below its M/A (last close -2.24%)—Sell signal effective 11/15/2018
International TTI: -2.49% below its M/A (last close -2.68%)—Sell signal effective 10/11/2018
Disclosure: I am obliged to inform you that I, as well as my advisory clients, own some of the ETFs listed in the above table. Furthermore, they do not represent a specific investment recommendation for you, they merely show which ETFs from the universe I track are falling.
Contact Ulli