
- Moving the markets
There was not much follow through from yesterday’s massive rally, but there was not much of a sell-off either, meaning that our new domestic “Buy” took effect today. We got our feet wet with some conservative exposure to “broadly diversified domestic ETFs,” while acknowledging that at any time momentum could turn around and head back the other way.
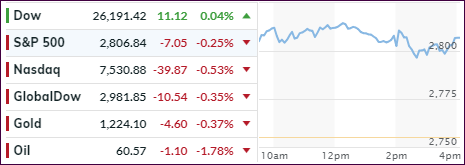
The danger of a such a head fake is always the greatest at the beginning of a new cycle where bulls and bears are still engaged in a tug-of-war. Such was the case today, as the Dow ventured above the unchanged line, although not very convincingly, while the S&P 500 and Nasdaq hovered below theirs leaving us with a mixed picture at the end of the session.
The Fed came out and did what was expected, namely not hiking rates this month but indicating that an increase will likely be in the cards for December. Market reaction was muted but some analysts, dissecting the Fed’s statement, saw hawkishness in their remarks, which contributed to the major indexes slumping.
The US dollar index was the beneficiary and popped while continuing its rise off yesterday’s bottom. Crude oil sank for the 9th day in a row and is now entrenched in a bear market, down -21.25% from October highs to 7-month lows. If it drops another day to 10 in a row, it will a dubious record in that this would represent the first time in 33 years of futures trading. Ouch!
- ETFs in the Spotlight
In case you missed the announcement and description of this section, you can read it here again.
It features 10 broadly diversified and sector ETFs from my HighVolume list as posted every Saturday. Furthermore, they are screened for the lowest MaxDD% number meaning they have been showing better resistance to temporary sell offs than all others over the past year.
The below table simply demonstrates the magnitude with which some of the ETFs are fluctuating regarding their positions above or below their respective individual trend lines (%M/A). A break below, represented by a negative number, shows weakness, while a break above, represented by a positive percentage, shows strength.
For hundreds of ETF choices, be sure to reference Thursday’s StatSheet.
Year to date, here’s how our candidates have fared so far:
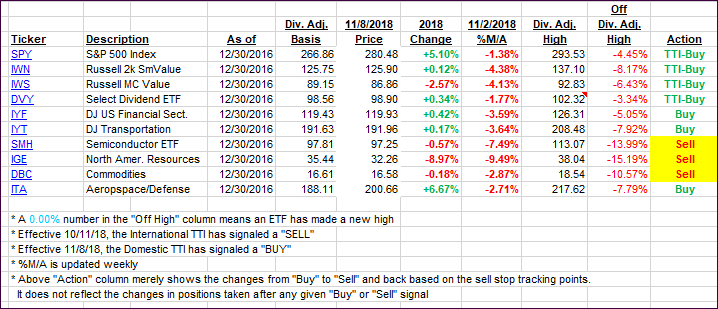
Again, the %M/A column above shows the position of the various ETFs in relation to their respective long-term trend lines, while the trailing sell stops are being tracked in the “Off High” column. The “Action” column will signal a “Sell” once the -8% point has been taken out in the “Off High” column. For more volatile sector ETFs, the trigger point is -10%.
- Trend Tracking Indexes (TTIs)
Our Trend Tracking Indexes (TTIs) slipped a tad as the indexes went predominantly sideways. Our Domestic “Buy” signal remains intact for the time being.
Here’s how we closed 11/08/2018:
Domestic TTI: +1.04% above its M/A (last close +1.12%)—Buy signal effective 11/08/2018
International TTI: -2.20% below its M/A (last close -1.89%)—Sell signal effective 10/11/2018
Disclosure: I am obliged to inform you that I, as well as my advisory clients, own some of the ETFs listed in the above table. Furthermore, they do not represent a specific investment recommendation for you, they merely show which ETFs from the universe I track are falling within the guidelines specified.
Contact Ulli