
- Moving the markets
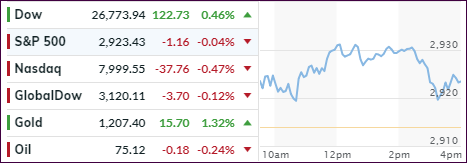
While the Dow managed to score not only a green close but also its 14th record of 2018, the S&P 500 and Nasdaq were the weaklings of the session and slipped slightly below their respective unchanged lines.
In other parts of the world, the activity was more bearish as the China ETF FXI lost -2.42%, despite China markets being closed for the “golden week.” In Italy, the country with the worst NPL loans as I pointed out yesterday, the markets went haywire by first diving sharply, after which panic buying ensured, which brought the price back to unchanged, as this chart from ZH shows. It’s odd and certainly not the sign of a healthy and sound environment when erratic moves like this occur.
While the Dow was enjoying its rise to a new record, the same can’t be said for SmallCaps (SCHA), which got spanked again after having broken a major support line, which had been in place since April. The 200-day M/A looks to be in striking distance now, and it would not surprise me to see this sector move into bear market territory.
Looking at it a different way, there is a major divergence between the Dow and the SmallCaps, which simply translates to the former outperforming the latter by a wide margin. As the chart shows, this divergence just came into play around the beginning of July.
What that means is that some sectors have rolled over and upward momentum is no longer broad based as you can see here. Big caps are holding up well, which is why I increased our exposure to them back in August. We’ll have to wait and see if this weakness will spread to other areas as well. It’s too early to tell, if Small- and MidCaps are resembling the proverbial canary in the coalmine.
- ETFs in the Spotlight
In case you missed the announcement and description of this section, you can read it here again.
It features 10 broadly diversified and sector ETFs from my HighVolume list as posted every Saturday. Furthermore, they are screened for the lowest MaxDD% number meaning they have been showing better resistance to temporary sell offs than all others over the past year.
The below table simply demonstrates the magnitude with which some of the ETFs are fluctuating regarding their positions above or below their respective individual trend lines (%M/A). A break below, represented by a negative number, shows weakness, while a break above, represented by a positive percentage, shows strength.
For hundreds of ETF choices, be sure to reference Thursday’s StatSheet.
Year to date, here’s how our candidates have fared so far:

Again, the %M/A column above shows the position of the various ETFs in relation to their respective long-term trend lines, while the trailing sell stops are being tracked in the “Off High” column. The “Action” column will signal a “Sell” once the -8% point has been taken out in the “Off High” column. For more volatile sector ETFs, the trigger point is -10%.
- Trend Tracking Indexes (TTIs)
Our Trend Tracking Indexes (TTIs) slipped as the major trend was predominantly sideways.
Here’s how we closed 10/02/2018:
Domestic TTI: +4.25% above its M/A (last close +4.40%)—Buy signal effective 4/4/2016
International TTI: +1.14% above its M/A (last close +1.24%)—Buy signal effective 7/26/2018
Disclosure: I am obliged to inform you that I, as well as my advisory clients, own some of
the ETFs listed in the above table. Furthermore, they do not represent a specific investment
recommendation for you, they merely show which ETFs from the universe I track are falling
within the guidelines specified.
Contact Ulli