
- Moving the markets
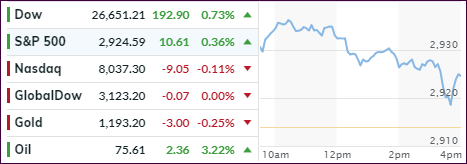
Right after the opening bells, the major indexes went into rally mode, as news of a surprise U.S.-Canada new NAFTA trade agreement pushed the S&P 500 within shouting distance of its intraday record. Finally, some good news on trade after months of haggling and infighting within the various parties.
The euphoric mood waned somewhat throughout the session with the Nasdaq giving back all early gains and slipping below its unchanged line, but the Dow and S&P, despite coming off their early highs, saved the day by closing in the green. But, SmallCaps had their worst day in over two months, so the rally was anything but broad.
Emerging markets were back in the spotlight, as not just the strong US dollar is wreaking havoc with their currencies but also a toxic mix of global tensions, rising US interest rates and now surging oil prices contribute to the overall misery. Take a look at this chart, which shows the YTD percentage change in oil prices in the various regions. Ouch!
India moved to center stage by announcing that it nationalized one of their banks caused by a surge in NPLs (non-performing loans), an unprecedented move that some analysts have put in the “panic” category. Of course, it’s well known that the leader of NPLs is Italy, which is in the middle of a collapsing banking system. But how do those two compare to the rest of the world? This chart below gives us the answer:
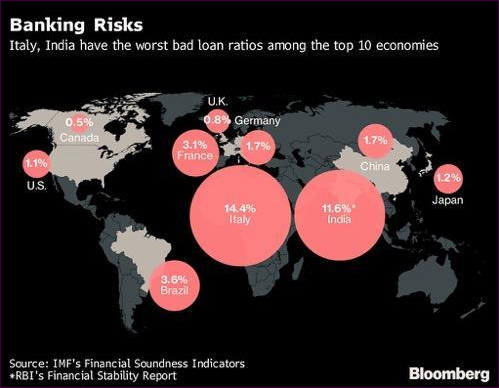
I think it’s important to be aware of the status and goings on in emerging markets (EMs). Many of the major banks are invested in these areas, and a domino effect will surely spread to developed countries should the EM situation worsen to a point were loans will be outright defaulted on.
- ETFs in the Spotlight
In case you missed the announcement and description of this section, you can read it here again.
It features 10 broadly diversified and sector ETFs from my HighVolume list as posted every Saturday. Furthermore, they are screened for the lowest MaxDD% number meaning they have been showing better resistance to temporary sell offs than all others over the past year.
The below table simply demonstrates the magnitude with which some of the ETFs are fluctuating regarding their positions above or below their respective individual trend lines (%M/A). A break below, represented by a negative number, shows weakness, while a break above, represented by a positive percentage, shows strength.
For hundreds of ETF choices, be sure to reference Thursday’s StatSheet.
Year to date, here’s how our candidates have fared so far:

Again, the %M/A column above shows the position of the various ETFs in relation to their respective long-term trend lines, while the trailing sell stops are being tracked in the “Off High” column. The “Action” column will signal a “Sell” once the -8% point has been taken out in the “Off High” column. For more volatile sector ETFs, the trigger point is -10%.
- Trend Tracking Indexes (TTIs)
Our Trend Tracking Indexes (TTIs) remained just about the same as last Friday.
Here’s how we closed 10/01/2018:
Domestic TTI: +4.40% above its M/A (last close +4.40%)—Buy signal effective 4/4/2016
International TTI: +1.24% above its M/A (last close +1.18%)—Buy signal effective 7/26/2018
Disclosure: I am obliged to inform you that I, as well as my advisory clients, own some of
the ETFs listed in the above table. Furthermore, they do not represent a specific investment
recommendation for you, they merely show which ETFs from the universe I track are falling
within the guidelines specified.
Contact Ulli