
- Moving the markets
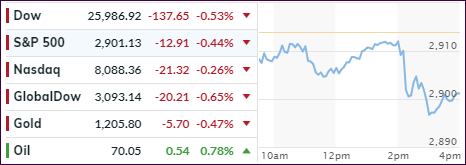
All good things must end eventually. That was the case today, as the 4-day win streak was snapped with the major indexes slipping modestly ahead of the Labor Day weekend. Sure, after scoring repeated record highs, a pause was in order, but at mid-day other factors contributed to the sudden downside acceleration.
Abruptly, tariff troubles were on everybody’s mind when news headlines announced, what everyone already knew, that $200 billion of China tariffs were set to be implemented next week after the expiration of the ‘comment’ period. That was enough to finally give the bears some ammunition and south we went, as the VIX and S&P 500 continued their decoupling.
Not reported much by MSM was the bloodbath in the Emerging Markets’ currencies (EM), which accelerated throughout the day. The problems seem to be deepening with the Indian Rupee, Brazilian Real, and the Turkish Lira getting spanked hard. Topping off the charts as the biggest loser of the day was the Argentinian Peso, which crashed, despite a rate hike, but bounced into the close.
These are critical development and, while in their early stages, will spread and likely affect the European banking system and then move eventually across the Atlantic. For right now, they appear to be localized events until, one day, investors realize that we are all financially connected and affected, and that there is no true isolation.
While I don’t expect much enthusiasm tomorrow, it being the last trading day of August when volume will likely slow to a crawl, the EM currencies may continue their radical moves. I for one think that these are important developments, maybe representing the infamous canary in the coalmine, and will stay on top of their changes and the havoc they may be creating.
- ETFs in the Spotlight
In case you missed the announcement and description of this section, you can read it here again.
It features 10 broadly diversified and sector ETFs from my HighVolume list as posted every Saturday. Furthermore, they are screened for the lowest MaxDD% number meaning they have been showing better resistance to temporary sell offs than all others over the past year.
The below table simply demonstrates the magnitude with which some of the ETFs are fluctuating regarding their positions above or below their respective individual trend lines (%M/A). A break below, represented by a negative number, shows weakness, while a break above, represented by a positive percentage, shows strength.
For hundreds of ETF choices, be sure to reference Thursday’s StatSheet.
Year to date, here’s how our candidates have fared so far:
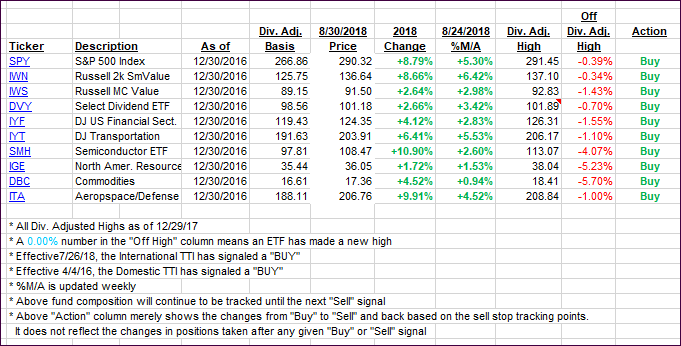
Again, the %M/A column above shows the position of the various ETFs in relation to their respective long-term trend lines, while the trailing sell stops are being tracked in the “Off High” column. The “Action” column will signal a “Sell” once the -8% point has been taken out in the “Off High” column. For more volatile sector ETFs, the trigger point is -10%.
- Trend Tracking Indexes (TTIs)
Our Trend Tracking Indexes (TTIs) slipped as the bears finally managed to pull the markets off their lofty levels.
Here’s how we closed 08/30/2018:
Domestic TTI: +5.26% above its M/A (last close +5.93%)—Buy signal effective 4/4/2016
International TTI: +0.47% above its M/A (last close +1.19%)—Buy signal effective 7/26/2018
Disclosure: I am obliged to inform you that I, as well as my advisory clients, own some of the ETFs listed in the above table. Furthermore, they do not represent a specific investment recommendation for you, they merely show which ETFs from the universe I track are falling within the guidelines specified.
Contact Ulli