
- Moving the markets
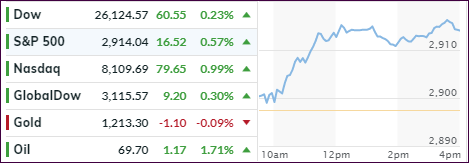
And the beat goes on. At least for the moment, the major indexes act like a run-away train with nothing being able to stop it. The S&P 500 and Nasdaq are continuing to rip higher and scored a 4th straight record close while the Dow finished at its highest point since February.
Helping equities levitate to ever higher levels was a revised 2nd Qtr. GDP number, with a second estimate of 4.23% (annualized) vs. the original 4.0%. That makes it the highest since the summer of 2016. Then there was renewed optimism that a new trade deal with Canada may be forthcoming, possibly in a similar fashion like the one just announced with Mexico.
On the downside, we saw that pending home sales slumped for the 7th straight month by -0.7% missing expectations (+0.3%) by a wide margin and confirming that housing has hit the broadest slowdown in years. Remember that recent reports showed similarly dismal results for Existing- and New-home sales as well as mortgage applications.
With all that euphoria going on, it’s worthy to note that the decoupling continues. There is the Chinese Yuan which, after staging a nice rally, has recently shown weakness again. Bond yields have come off their highs and are showing this picture when charted against the S&P 500. And last, but not least, the Emerging Market currencies are collapsing again, as shown here in today’s chart.
When this type of decoupling occurs, it’s just a matter of time that these discrepancies will correct to fair value. The open-ended question is: In which direction will the correction occur? We will have to wait and see, but let’s enjoy the present moment of being on the ‘right’ side of the market.
- ETFs in the Spotlight
In case you missed the announcement and description of this section, you can read it here again.
It features 10 broadly diversified and sector ETFs from my HighVolume list as posted every Saturday. Furthermore, they are screened for the lowest MaxDD% number meaning they have been showing better resistance to temporary sell offs than all others over the past year.
The below table simply demonstrates the magnitude with which some of the ETFs are fluctuating regarding their positions above or below their respective individual trend lines (%M/A). A break below, represented by a negative number, shows weakness, while a break above, represented by a positive percentage, shows strength.
For hundreds of ETF choices, be sure to reference Thursday’s StatSheet.
Year to date, here’s how our candidates have fared so far:
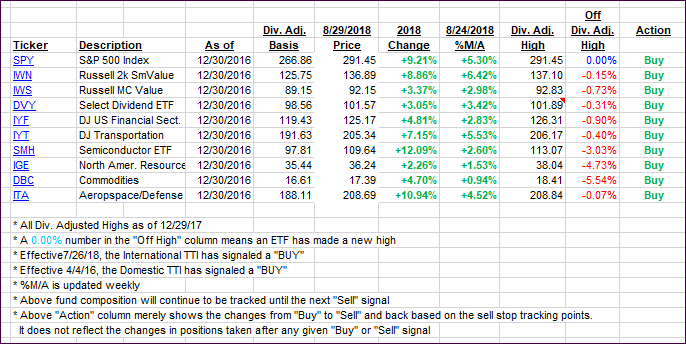
Again, the %M/A column above shows the position of the various ETFs in relation to their respective long-term trend lines, while the trailing sell stops are being tracked in the “Off High” column. The “Action” column will signal a “Sell” once the -8% point has been taken out in the “Off High” column. For more volatile sector ETFs, the trigger point is -10%.
- Trend Tracking Indexes (TTIs)
Our Trend Tracking Indexes (TTIs) joined the bulls and moved up.
Here’s how we closed 08/29/2018:
Domestic TTI: +5.93% above its M/A (last close +5.52%)—Buy signal effective 4/4/2016
International TTI: +1.19% above its M/A (last close +0.85%)—Buy signal effective 7/26/2018
Disclosure: I am obliged to inform you that I, as well as my advisory clients, own some of the ETFs listed in the above table. Furthermore, they do not represent a specific investment recommendation for you, they merely show which ETFs from the universe I track are falling within the guidelines specified.
Contact Ulli