
- Moving the markets
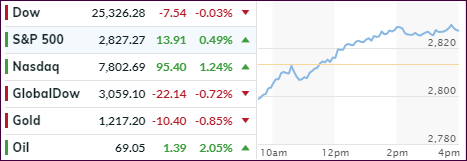
With no adverse trade news making the headlines, it was Apple’s (AAPL) day to shine as it not only lifted the indexes but also managed to become the first $1 trillion company—ever.
The S&P 500 and the Nasdaq gained solidly after a slow start at the opening, but then rocketed higher without looking back. Despite Apple’s valiant effort to support the markets, it just fell a tad short of pushing the Dow into the green. Nevertheless, the Dow’s comeback from -240 points at the opening to almost unchanged sure qualifies as a “rally” as well.
Apple’s run came on the heels of a strong earnings report, along with an upbeat outlook, which even pushed trade concerns to the back burner, at least for the moment. Not to worry, those will be back as a response to Trump’s tariff increase from 10% to 25% will sure be forthcoming.
Speaking of tariff threats and sanctions, at least for today, the scene shifted to Turkey where the Lira tumbled to record lows while in China the Yuan took another steep plunge (as did their stocks). That makes me wonder if Trump’s latest increase to 25% need to be higher to compensate for the latest Yuan devaluation?
I am being facetious, of course, but it looks that this movie is far from being over, and the battles will continue unabated. This leaves me pondering the obvious question: “How long will it take until the US markets will be affected?”
- ETFs in the Spotlight
In case you missed the announcement and description of this section, you can read it here again.
It features 10 broadly diversified and sector ETFs from my HighVolume list as posted every Saturday. Furthermore, they are screened for the lowest MaxDD% number meaning they have been showing better resistance to temporary sell offs than all others over the past year.
The below table simply demonstrates the magnitude with which some of the ETFs are fluctuating regarding their positions above or below their respective individual trend lines (%M/A). A break below, represented by a negative number, shows weakness, while a break above, represented by a positive percentage, shows strength.
For hundreds of ETF choices, be sure to reference Thursday’s StatSheet.
Year to date, here’s how our candidates have fared so far:
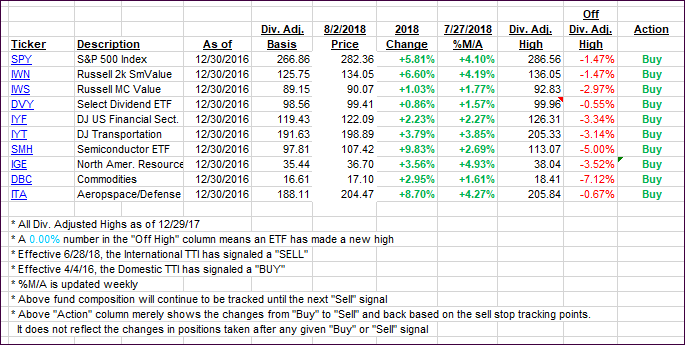
Again, the %M/A column above shows the position of the various ETFs in relation to their respective long-term trend lines, while the trailing sell stops are being tracked in the “Off High” column. The “Action” column will signal a “Sell” once the -8% point has been taken out in the “Off High” column. For more volatile sector ETFs, the trigger point is -10%.
- Trend Tracking Indexes (TTIs)
Our Trend Tracking Indexes (TTIs) were mixed with the Domestic one rallying and the International one showing weakness.
Here’s how we closed 08/02/2018:
Domestic TTI: +2.59% above its M/A (last close +2.02%)—Buy signal effective 4/4/2016
International TTI: +0.35% above its M/A (last close +1.02%)—Buy signal effective 7/26/2018
Disclosure: I am obliged to inform you that I, as well as my advisory clients, own some of the ETFs listed in the above table. Furthermore, they do not represent a specific investment recommendation for you, they merely show which ETFs from the universe I track are falling within the guidelines specified.
Contact Ulli