
- Moving the markets
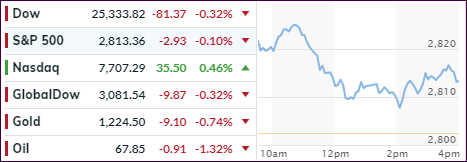
There was some afterglow this morning with the major indexes storming into positive territory on the heels of Apple’s blow out earnings report, which was released yesterday afternoon.
However, the initial euphoria was short-lived and faded as reality set in via a variety of events pushing 2 of the 3 indexes back into the red. The Nasdaq stayed above its unchanged line only due to Apple’s strong performance.
The Fed confirmed via its FOMC statement that the economy remains strong and that 2 more rate hikes were in store for 2018. Bonds reacted, and the 10-year yield advanced 4 basis points and closed right on its overhead glass ceiling of 3%. It sure looks like that the high of this year (3.11%) will be taken out shortly.
Despite the Fed’s jawboning about a “strong” economy, US manufacturing did a 180 by slumping to its weakest this year with prices surging and orders tumbling. I guess it’s all in the earnings. With 80% of the S&P stocks having reported better-than-expected second quarter earnings, which is well above the historical average of 67%, nothing else matters.
But, the bullish spirits were dampened somewhat by the ongoing trade differences between the US and China. Trump has now upped the ante to propose raising tariffs on $200 billion worth of Chinese products not by 10%, as previously announced, but 25%.
I can’t wait for the rebuttal. If it’s big enough, it sure will have a market moving effect the bears will like.
- ETFs in the Spotlight
In case you missed the announcement and description of this section, you can read it here again.
It features 10 broadly diversified and sector ETFs from my HighVolume list as posted every Saturday. Furthermore, they are screened for the lowest MaxDD% number meaning they have been showing better resistance to temporary sell offs than all others over the past year.
The below table simply demonstrates the magnitude with which some of the ETFs are fluctuating regarding their positions above or below their respective individual trend lines (%M/A). A break below, represented by a negative number, shows weakness, while a break above, represented by a positive percentage, shows strength.
For hundreds of ETF choices, be sure to reference Thursday’s StatSheet.
Year to date, here’s how our candidates have fared so far:
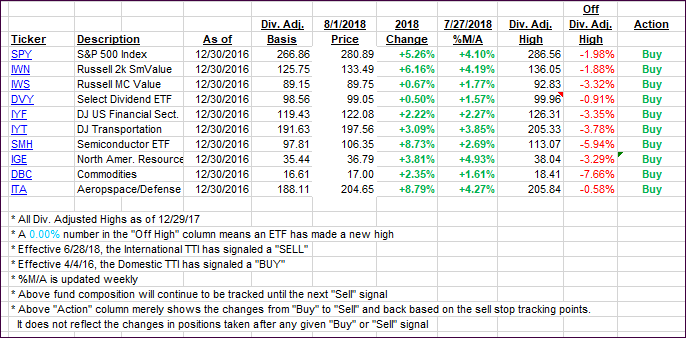
Again, the %M/A column above shows the position of the various ETFs in relation to their respective long-term trend lines, while the trailing sell stops are being tracked in the “Off High” column. The “Action” column will signal a “Sell” once the -8% point has been taken out in the “Off High” column. For more volatile sector ETFs, the trigger point is -10%.
- Trend Tracking Indexes (TTIs)
Our Trend Tracking Indexes (TTIs) changed immaterially as the markets presented a mixed picture.
Here’s how we closed 08/01/2018:
Domestic TTI: +2.10% above its M/A (last close +2.02%)—Buy signal effective 4/4/2016
International TTI: +0.86% above its M/A (last close +1.02%)—Buy signal effective 7/26/2018
Disclosure: I am obliged to inform you that I, as well as my advisory clients, own some of the ETFs listed in the above table. Furthermore, they do not represent a specific investment recommendation for you, they merely show which ETFs from the universe I track are falling within the guidelines specified.
Contact Ulli