
- Moving the markets
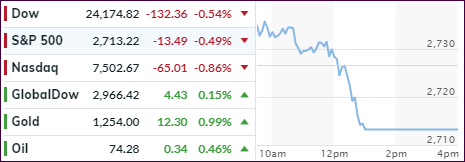
Yesterday’s late recovery rally continued this morning, but suddenly died, as momentum reversed, which sent the major indexes diving into the red. Weakness in tech and financials eclipsed positive moves in the telecom, energy and real estate sectors.
Contributing to the tech sectors downward swing was Micron Technology, which appears to have been a casualty of the US/China trade war after China announced that it was blocking the firm from selling some of its chips in China. It was made clear, however, that this was only on a temporary basis.
The strong US opening was assisted by prior gains in European markets where a last-minute deal on immigration in Germany saved not only Chancellor Merkel’s coalition but also possibly her job.
In the end, volume was low as many traders were absent, and will probably remain so during this Holiday shortened week. Low volume moves can be extreme, but they may not be necessarily a prognosticator of things to come. That’s why I would not read too much into this week’s activity.
Happy 4th of July!
- ETFs in the Spotlight
In case you missed the announcement and description of this section, you can read it here again.
It features 10 broadly diversified and sector ETFs from my HighVolume list as posted every Saturday. Furthermore, they are screened for the lowest MaxDD% number meaning they have been showing better resistance to temporary sell offs than all others over the past year.
The below table simply demonstrates the magnitude with which some of the ETFs are fluctuating regarding their positions above or below their respective individual trend lines (%M/A). A break below, represented by a negative number, shows weakness, while a break above, represented by a positive percentage, shows strength.
For hundreds of ETF choices, be sure to reference Thursday’s StatSheet.
Year to date, here’s how our candidates have fared so far:
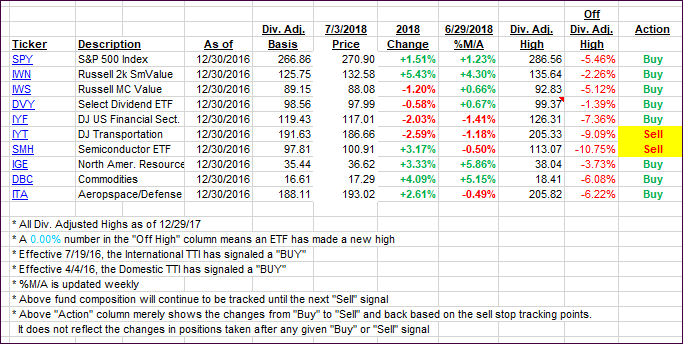
Again, the %M/A column above shows the position of the various ETFs in relation to their respective long-term trend lines, while the trailing sell stops are being tracked in the “Off High” column. The “Action” column will signal a “Sell” once the -7.5% point has been taken out in the “Off High” column.
- Trend Tracking Indexes (TTIs)
Our Trend Tracking Indexes (TTIs) we saw the opposite close from yesterday, as the Domestic TTI showed more weakness than its International cousin.
Here’s how we closed 07/03/2018:
Domestic TTI: +1.40% above its M/A (last close +1.63%)—Buy signal effective 4/4/2016
International TTI: -1.51% below its M/A (last close -1.61%)—Sell signal effective 6/28/2018
Disclosure: I am obliged to inform you that I, as well as my advisory clients, own some of the ETFs listed in the above table. Furthermore, they do not represent a specific investment recommendation for you, they merely show which ETFs from the universe I track are falling within the guidelines specified.
Contact Ulli