
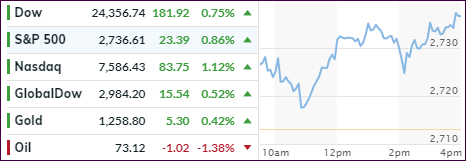
- Moving the markets
The major indexes whipsawed throughout the session, however, all action happened above the unchanged line with the tech sector having its best session in over a month.
Helping the positive mood were reports indicating an easing of trade tensions with especially Germany’s car sector enjoying a nice rebound after one newspaper published an unsubstantiated report regarding zero tariffs for cars to the US.
The Fed minutes were in focus as policy makers saw “negative risks” from US trade policy and elaborated that more tit-for-tat could have “negative effects on business sentiment and investment spending,” hardly an earth-shattering conclusion.
Then this: The Fed said there was “broad support for continued gradual increases”, despite some fallout from the negative impact of the trade wars. In the end, it was mentioned that the federal funds rate could be at or above its neutral level sometime next year, and projections were for two more rate hikes in 2018, which translates to one more than expected.
Despite this hawkish assessment, the markets faded only a bit and then popped with the major indexes closing near the highs of the session.
On deck for tomorrow is the all-important and potentially market-moving jobs report, which had a negative front runner today, AKA the ADP private sector report, which showed a gain of 177k jobs in June vs. an expected 190k. We’ll have to see if that weakness affects tomorrow’s payroll as well.
Continue reading…
- ETFs in the Spotlight
In case you missed the announcement and description of this section, you can read it here again.
It features 10 broadly diversified and sector ETFs from my HighVolume list as posted every Saturday. Furthermore, they are screened for the lowest MaxDD% number meaning they have been showing better resistance to temporary sell offs than all others over the past year.
The below table simply demonstrates the magnitude with which some of the ETFs are fluctuating regarding their positions above or below their respective individual trend lines (%M/A). A break below, represented by a negative number, shows weakness, while a break above, represented by a positive percentage, shows strength.
For hundreds of ETF choices, be sure to reference Thursday’s StatSheet.
Year to date, here’s how our candidates have fared so far:
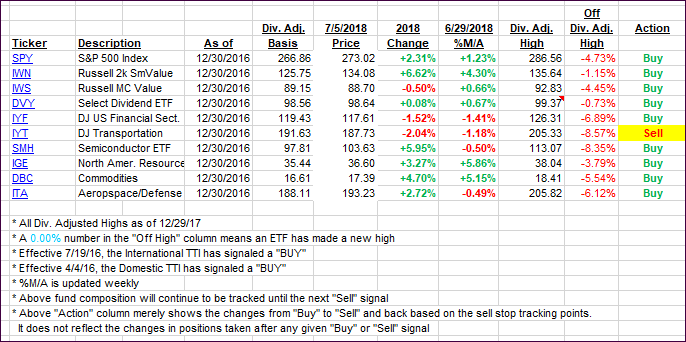
Again, the %M/A column above shows the position of the various ETFs in relation to their respective long-term trend lines, while the trailing sell stops are being tracked in the “Off High” column. The “Action” column will signal a “Sell” once the -7.5% point has been taken out in the “Off High” column.
- Trend Tracking Indexes (TTIs)
Our Trend Tracking Indexes (TTIs) both showed signs of strength.
Here’s how we closed 07/05/2018:
Domestic TTI: +1.78% above its M/A (last close +1.40%)—Buy signal effective 4/4/2016
International TTI: -0.93% below its M/A (last close -1.51%)—Sell signal effective 6/28/2018
Disclosure: I am obliged to inform you that I, as well as my advisory clients, own some of the ETFs listed in the above table. Furthermore, they do not represent a specific investment recommendation for you, they merely show which ETFs from the universe I track are falling within the guidelines specified.
Contact Ulli