
- Moving the markets
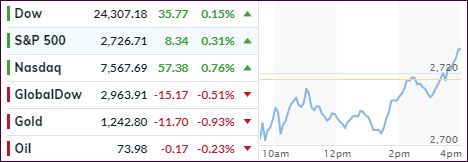
It was weak start to the 3rd quarter with the major indexes diving right after the opening bell, with the old stand-by, namely escalating trade tension, being the culprit and weighing on sentiment.
Despite this negative influence, a mid-day recovery, on the back of a rally in technology, turned things around and early losses were reversed, and we ended up seeing green numbers at the close.
Despite a positive finish, the trade battles go on, as the European Union (EU) has now threatened to respond with tariffs of $300 billion in US goods after Trump’s warning to slap a 20% tariff on auto imports from the EU.
And the game goes on: Tit for tat until eventually hopefully cooler heads will prevail and establish fair and just deals that everyone can agree to. In the meantime, the markets will remain in roller-coaster mode and react to the latest headline du jour.
On deck, and widely ignored, is the fact that the Fed’s QT program (Quantitative Tightening) will increase to $50 billion/month late in July from its current $30 billion. Makes me wonder how the markets will react, because, at the same time, the EU is fiddling with its reduction in QE (Quantitative Easing)?
- ETFs in the Spotlight
In case you missed the announcement and description of this section, you can read it here again.
It features 10 broadly diversified and sector ETFs from my HighVolume list as posted every Saturday. Furthermore, they are screened for the lowest MaxDD% number meaning they have been showing better resistance to temporary sell offs than all others over the past year.
The below table simply demonstrates the magnitude with which some of the ETFs are fluctuating regarding their positions above or below their respective individual trend lines (%M/A). A break below, represented by a negative number, shows weakness, while a break above, represented by a positive percentage, shows strength.
For hundreds of ETF choices, be sure to reference Thursday’s StatSheet.
Year to date, here’s how our candidates have fared so far:
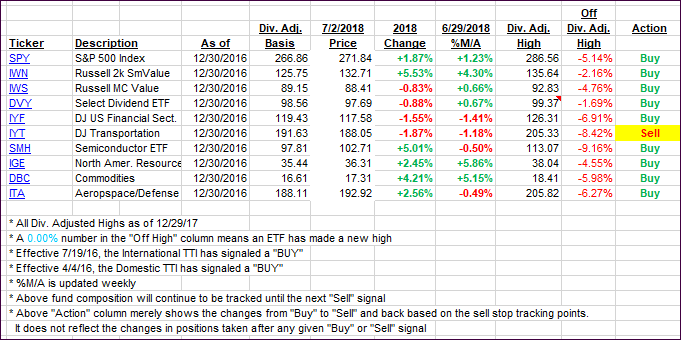
Again, the %M/A column above shows the position of the various ETFs in relation to their respective long-term trend lines, while the trailing sell stops are being tracked in the “Off High” column. The “Action” column will signal a “Sell” once the -7.5% point has been taken out in the “Off High” column.
- Trend Tracking Indexes (TTIs)
Our Trend Tracking Indexes (TTIs) were again mixed with the international one slipping deeper into bear market territory, while the Domestic one gained.
Here’s how we closed 07/02/2018:
Domestic TTI: +1.63% above its M/A (last close +1.45%)—Buy signal effective 4/4/2016
International TTI: -1.61% below its M/A (last close -1.20%)—Sell signal effective 6/28/2018
Disclosure: I am obliged to inform you that I, as well as my advisory clients, own some of the ETFs listed in the above table. Furthermore, they do not represent a specific investment recommendation for you, they merely show which ETFs from the universe I track are falling within the guidelines specified.
Contact Ulli