
- Moving the markets
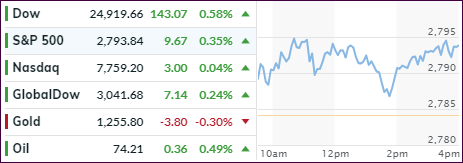
The bullish mood continued with the Dow and the S&P 500 making solid gains, while the Nasdaq lagged and barely stayed above the unchanged line. The Dow had its best win streak in the past 30 days, while the S&P 500 was homing in on a new 5-month high.
However, when looking at the bigger picture, the markets were mixed, if you take out the Dow and S&P 500. SmallCaps, despite being a top YTD performer, lagged and so did Transportations while, as mentioned above, the Nasdaq ended barely changed after making a record intra-day high.
This is now the fourth straight finish solidly in the green, as concerns over global trade disputes have clearly shifted with most of the focus now being on the upcoming second quarter earnings season, while newfound optimism over recent positive economic data points gave a much needed assist. One can only hope that recent trade tensions remain in the background.
I think we’ll find out quick if they will remain subdued, or if they suddenly make their make their presence felt by pulling some of the exuberance out of the markets.
- ETFs in the Spotlight
In case you missed the announcement and description of this section, you can read it here again.
It features 10 broadly diversified and sector ETFs from my HighVolume list as posted every Saturday. Furthermore, they are screened for the lowest MaxDD% number meaning they have been showing better resistance to temporary sell offs than all others over the past year.
The below table simply demonstrates the magnitude with which some of the ETFs are fluctuating regarding their positions above or below their respective individual trend lines (%M/A). A break below, represented by a negative number, shows weakness, while a break above, represented by a positive percentage, shows strength.
For hundreds of ETF choices, be sure to reference Thursday’s StatSheet.
Year to date, here’s how our candidates have fared so far:
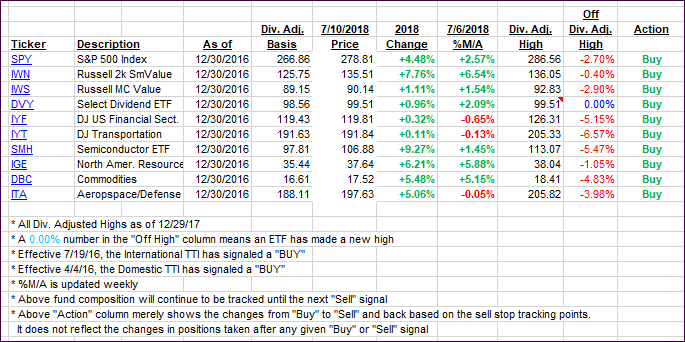
Again, the %M/A column above shows the position of the various ETFs in relation to their respective long-term trend lines, while the trailing sell stops are being tracked in the “Off High” column. The “Action” column will signal a “Sell” once the -7.5% point has been taken out in the “Off High” column.
- Trend Tracking Indexes (TTIs)
Our Trend Tracking Indexes (TTIs) inched higher as the bullish theme prevailed. I am still waiting to see if the International TTI can remain on the bullish side a while longer and move higher before declaring the “Sell” to be over.
Here’s how we closed 07/10/2018:
Domestic TTI: +2.56% above its M/A (last close +2.49%)—Buy signal effective 4/4/2016
International TTI: +0.58% above its M/A (last close +0.43%)—Sell signal effective 6/28/2018
Disclosure: I am obliged to inform you that I, as well as my advisory clients, own some of the ETFs listed in the above table. Furthermore, they do not represent a specific investment recommendation for you, they merely show which ETFs from the universe I track are falling within the guidelines specified.
Contact Ulli