
- Moving the markets
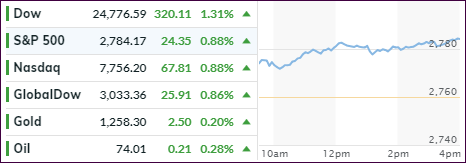
The bulls were clearly in charge with the major indexes jumping right after the opening bell and remaining solidly above the unchanged line. The Dow shook off some of its recent weakness by scoring a triple digit gain and notching a third straight winning session, which put it back to slightly positive (+0.2%) for the year.
With 2/3 of economic activity coming from consumers to buy things they don’t need with money they don’t have, the Fed was delighted to present data showing that total consumer credit increased 7.6%, the fastest pace of credit growth since November. This came on top of Friday’s stronger than expected jobs report and assisted this euphoric rally, while, at least for the moment, any trade war anxieties were brushed aside.
As a result, two of the more depressed sectors showed signs of life, namely industrials and financials, which led the way to higher prices. This caused bond yields to climb with the 10-year adding 4 basis points to end the day at 2.86%.
As I posted last week, bond yields and the S&P 500 remain out of sync, as this chart shows. They will eventually align, but there is no hard and fast rule as to how soon this will occur. We may very well see more upside momentum before some of this exuberance will dissipate.
- ETFs in the Spotlight
In case you missed the announcement and description of this section, you can read it here again.
It features 10 broadly diversified and sector ETFs from my HighVolume list as posted every Saturday. Furthermore, they are screened for the lowest MaxDD% number meaning they have been showing better resistance to temporary sell offs than all others over the past year.
The below table simply demonstrates the magnitude with which some of the ETFs are fluctuating regarding their positions above or below their respective individual trend lines (%M/A). A break below, represented by a negative number, shows weakness, while a break above, represented by a positive percentage, shows strength.
For hundreds of ETF choices, be sure to reference Thursday’s StatSheet.
Year to date, here’s how our candidates have fared so far:
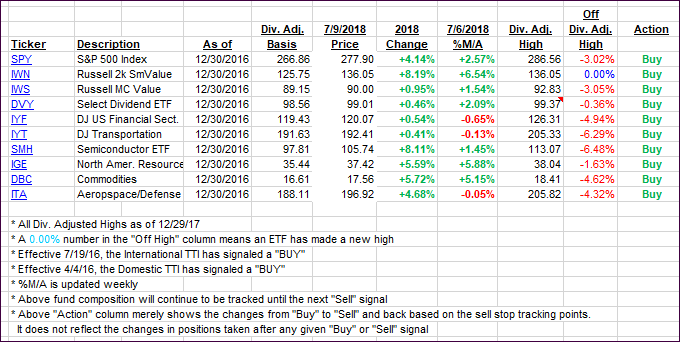
Again, the %M/A column above shows the position of the various ETFs in relation to their respective long-term trend lines, while the trailing sell stops are being tracked in the “Off High” column. The “Action” column will signal a “Sell” once the -7.5% point has been taken out in the “Off High” column.
- Trend Tracking Indexes (TTIs)
Our Trend Tracking Indexes (TTIs) rallied with the International one now having crossed its trendline back into bullish territory. Again, I want to see some staying power above the line before declaring this current “Sell” signal to be over.
Here’s how we closed 07/09/2018:
Domestic TTI: +2.49% above its M/A (last close +2.09%)—Buy signal effective 4/4/2016
International TTI: +0.43% above its M/A (last close -0.23%)—Sell signal effective 6/28/2018
Disclosure: I am obliged to inform you that I, as well as my advisory clients, own some of the ETFs listed in the above table. Furthermore, they do not represent a specific investment recommendation for you, they merely show which ETFs from the universe I track are falling within the guidelines specified.
Contact Ulli