
- Moving the markets
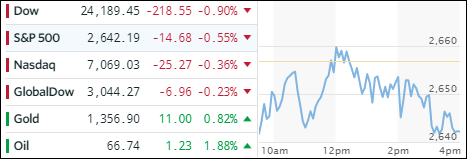
At least for one day, the U.S./China trade war battles were moved to the back burner, as geopolitical tensions dominated headline news, after tweets from President Trump that a military strike in Syria might be a possibility. That immediately ratcheted up verbal tensions with Russia, and the markets ended up being the fall guy by slipping into the close.
To me, most of this was just jawboning, after all, would you really want to announce an upcoming military strike? In any event, despite a mid-day attempt to conquer the unchanged line, downside momentum overwhelmed the bulls, and the major indexes closed modestly in the red.
Other data points had the CPI reports in line with expectations, while the minutes from the last Fed meeting included language suggesting that policy makers need to tap on the breaks of the economy. According to the Treasury, the government’s budget deficit was $209 billion in March, which was up 18% from the same month a year ago. Now that should have been headline news, but it was simply ignored. Go figure…
Interest rates slipped with the 10-year bond yield dropping 1 basis point to 2.79%. The US Dollar (UUP) continued its recent string of losses (-0.09%), while gold and crude oil bucked the trend by scoring solid gains.
- ETFs in the Spotlight
In case you missed the announcement and description of this section, you can read it here again.
It features 10 broadly diversified and sector ETFs from my HighVolume list as posted every Saturday. Furthermore, they are screened for the lowest MaxDD% number meaning they have been showing better resistance to temporary sell offs than all others over the past year.
The below table simply demonstrates the magnitude with which some of the ETFs are fluctuating in regards to their positions above or below their respective individual trend lines (%M/A). A break below, represented by a negative number, shows weakness, while a break above, represented by a positive percentage, shows strength.
For hundreds of ETF choices, be sure to reference Thursday’s StatSheet.
Year to date, here’s how our candidates have fared so far:
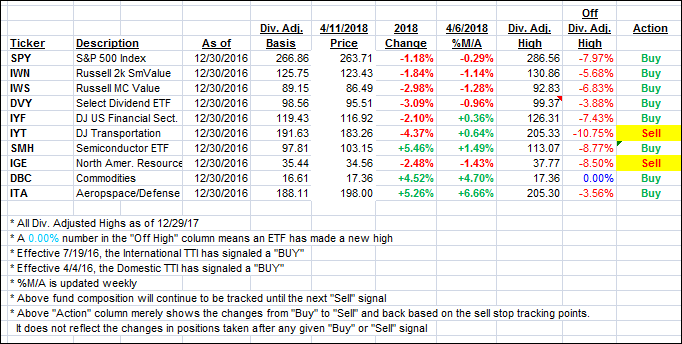
Again, the %M/A column above shows the position of the various ETFs in relation to their respective long term trend lines, while the trailing sell stops are being tracked in the “Off High” column. The “Action” column will signal a “Sell” once the -7.5% point has been taken out in the “Off High” column.
- Trend Tracking Indexes (TTIs)
Our Trend Tracking Indexes (TTIs) slipped as the major indexes pulled back.
Here’s how we closed 4/11/2018:
Domestic TTI: +1.22% above its M/A (last close +1.38%)—Buy signal effective 4/4/2016
International TTI: +1.73% below its M/A (last close +1.99%)—Buy signal effective 7/19/2016
Disclosure: I am obliged to inform you that I, as well as my advisory clients, own some of the ETFs listed in the above table. Furthermore, they do not represent a specific investment recommendation for you, they merely show which ETFs from the universe I track are falling within the guidelines specified.
Contact Ulli