
- Moving the markets
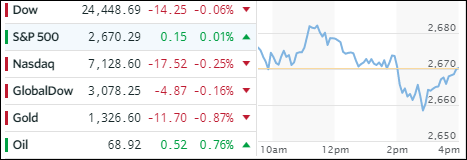
It was a mixed bag on the earnings front, as the latest reports can be best described as “so so,” which sent the major indexes initially higher but disappointment pulled the markets back below the unchanged line, with the exception of the S&P 500, which ended higher by a tiny fraction.
As I mentioned before, the 3% level of the 10-year bond yield will be a crucial point for equities. That became clear again today with weakness setting in as the yield surged towards that psychologically important marker but backed off prior to the end of the session saving equities from a sharper downturn. It now appears to be just a matter of time before we reach/cross that level which we last saw in January 2014.
Not helping matters was the fact that traders are now pricing in 4 interest rate hikes for 2018 rather than previously hoped for 3 increases.
The VIX pumped, dumped and pumped again helping the S&P 500 get back to its break-even point. Bank stocks tanked and FANGs stumbled, but the US Dollar (UUP) rallied for its 5th day in a row (crushing the shorts in the process) by gaining +0.63% and is now within spitting distance of conquering its 200-day M/A.
- ETFs in the Spotlight
In case you missed the announcement and description of this section, you can read it here again.
It features 10 broadly diversified and sector ETFs from my HighVolume list as posted every Saturday. Furthermore, they are screened for the lowest MaxDD% number meaning they have been showing better resistance to temporary sell offs than all others over the past year.
The below table simply demonstrates the magnitude with which some of the ETFs are fluctuating in regards to their positions above or below their respective individual trend lines (%M/A). A break below, represented by a negative number, shows weakness, while a break above, represented by a positive percentage, shows strength.
For hundreds of ETF choices, be sure to reference Thursday’s StatSheet.
Year to date, here’s how our candidates have fared so far:
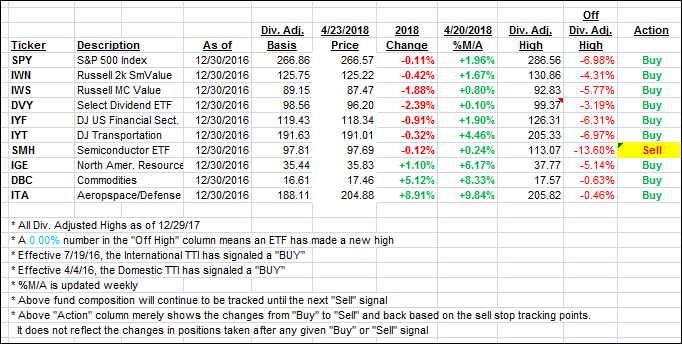
Again, the %M/A column above shows the position of the various ETFs in relation to their respective long term trend lines, while the trailing sell stops are being tracked in the “Off High” column. The “Action” column will signal a “Sell” once the -7.5% point has been taken out in the “Off High” column.
- Trend Tracking Indexes (TTIs)
Our Trend Tracking Indexes (TTIs) slipped for the second day in a row.
Here’s how we closed 4/23/2018:
Domestic TTI: +1.23% above its M/A (last close +1.30%)—Buy signal effective 4/4/2016
International TTI: +2.01% below its M/A (last close +2.18%)—Buy signal effective 7/19/2016
Disclosure: I am obliged to inform you that I, as well as my advisory clients, own some of the ETFs listed in the above table. Furthermore, they do not represent a specific investment recommendation for you, they merely show which ETFs from the universe I track are falling within the guidelines specified.
Contact Ulli