
- Moving the markets
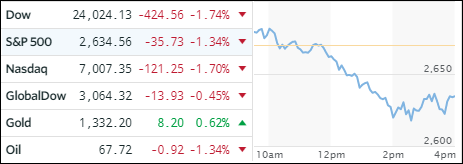
A quiet opening above the unchanged line suddenly turned into a rout with the major indexes tumbling and heading sharply south until dip buyers stepped in during the last hour to lessen the damage. The Industrial, material and technology sectors were most affected.
The culprit, as I have been posting about, was the 10-year bond yield, which spiked and briefly touched the psychologically important 3% level (first time in 4 years) without breaking it to the upside. Indeed, this event spooked the Wall Street crowd, as buyers were conspicuously absent, giving the bears an easy win over this session.
Higher interest rates and a sharp dive of -6.83% by 3M combined to push the Dow lower by over 400 points, which turned out to be the worst performance of the 3 major indexes. Even the results from the earnings season were interpreted as more negative than positive despite some report cards beating analysts’ forecasts. In other words, good earnings were simply not good enough to give an assist to equities.
While the 10-year bond yield pulled back to 2.979% after touching the 3% level, I think markets will remain shaky and in sell-off mode, unless bond yields head back south again, which appears questionable at this point. That brings into play a potential “Sell” signal for our Trend Tracking Indexes (TTIs).
Right now, there is still a little room to for the indexes to fall without affecting a trend line break to the downside (see section 3). However, considering the speed with which markets are moving, this could be just a matter of days—unless, of course, buyers find reasons to step up to the plate and exert their bullish forces.
Summing up the session best was economist David Rosenberg (Hat tip goes to ZH for this quote):
“I don’t know about anyone else, but I find it humorous that the stock promoters on bubble vision who told us heading into the peak that valuations don’t matter are now talking about how cheap the equity market is!”
- ETFs in the Spotlight
In case you missed the announcement and description of this section, you can read it here again.
It features 10 broadly diversified and sector ETFs from my HighVolume list as posted every Saturday. Furthermore, they are screened for the lowest MaxDD% number meaning they have been showing better resistance to temporary sell offs than all others over the past year.
The below table simply demonstrates the magnitude with which some of the ETFs are fluctuating in regards to their positions above or below their respective individual trend lines (%M/A). A break below, represented by a negative number, shows weakness, while a break above, represented by a positive percentage, shows strength.
For hundreds of ETF choices, be sure to reference Thursday’s StatSheet.
Year to date, here’s how our candidates have fared so far:
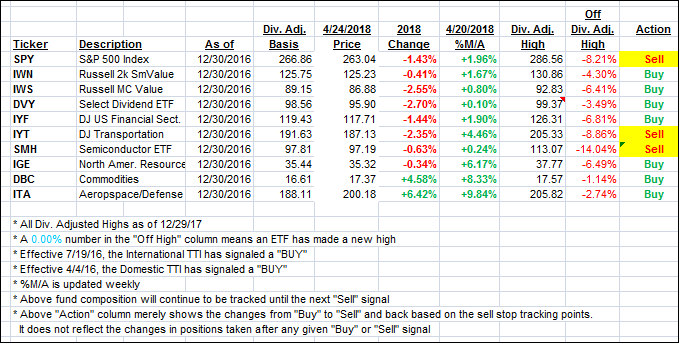
Again, the %M/A column above shows the position of the various ETFs in relation to their respective long term trend lines, while the trailing sell stops are being tracked in the “Off High” column. The “Action” column will signal a “Sell” once the -7.5% point has been taken out in the “Off High” column.
- Trend Tracking Indexes (TTIs)
Our Trend Tracking Indexes (TTIs) headed south as the bears were in charge.
Here’s how we closed 4/24/2018:
Domestic TTI: +0.59% above its M/A (last close +1.23%)—Buy signal effective 4/4/2016
International TTI: +1.35% below its M/A (last close +2.01%)—Buy signal effective 7/19/2016
Disclosure: I am obliged to inform you that I, as well as my advisory clients, own some of the ETFs listed in the above table. Furthermore, they do not represent a specific investment recommendation for you, they merely show which ETFs from the universe I track are falling within the guidelines specified.
Contact Ulli