
- Moving the markets
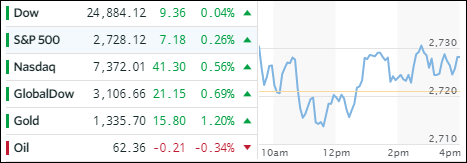
The S&P 500 chart clearly demonstrates the kind of trading session we saw today with wild swings in the averages, below and above their respective trend lines, resembling a bucking bronco. In the end, the bulls notched a victory and scored modest gains.
There were only two news items which created this wild market behavior. First, there were positive developments between North and South Korea agreeing to hold their first summit in April, after more than 10 years of silence. Second, the tariff hype game found some opposition in the Republican Party, but Trump appeared to show some willingness to be flexible on trade tariffs with Canada and Mexico. But, any clarity is still missing making me believe that markets will continue with their erratic reactions to the latest headline ping pong.
Nevertheless, the bulls prevailed, and our selected ETFs ended up in the green. With the Nasdaq outperforming on the day, it’s no surprise that Semiconductors (SMH) lead the pack with +1.47%. International SmallCaps (SCHC +0.99%) and International Equities (SCHF +0.77%) took second and third place respectively. Aerospace & Defense (ITA) lagged with -0.17%.
Despite the volatility in equities, interest rates were tame with the 10-year bond yield remaining unchanged at 2.88%. The US Dollar (UUP) headed back south by -0.26% giving back some of its recently earned gains.
- ETFs in the Spotlight
In case you missed the announcement and description of this section, you can read it here again.
It features 10 broadly diversified and sector ETFs from my HighVolume list as posted every Saturday. Furthermore, they are screened for the lowest MaxDD% number meaning they have been showing better resistance to temporary sell offs than all others over the past year.
The below table simply demonstrates the magnitude with which some of the ETFs are fluctuating in regards to their positions above or below their respective individual trend lines (%M/A). A break below, represented by a negative number, shows weakness, while a break above, represented by a positive percentage, shows strength.
For hundreds of ETF choices, be sure to reference Thursday’s StatSheet.
Year to date, here’s how our candidates have fared so far:
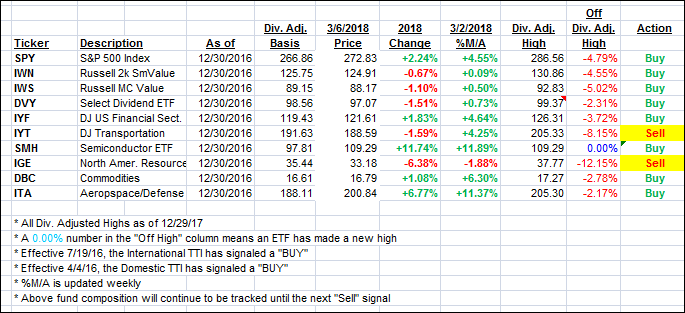
Again, the %M/A column above shows the position of the various ETFs in relation to their respective long term trend lines, while the trailing sell stops are being tracked in the “Off High” column. The “Action” column will signal a “Sell” once the -7.5% point has been taken out in the “Off High” column.
- Trend Tracking Indexes (TTIs)
Our Trend Tracking Indexes (TTIs) climbed for the second day in a row.
Here’s how we closed 3/06/2018:
Domestic TTI: +3.18% above its M/A (last close +2.95%)—Buy signal effective 4/4/2016
International TTI: +2.81% above its M/A (last close +2.36%)—Buy signal effective 7/19/2016
Disclosure: I am obliged to inform you that I, as well as my advisory clients, own some of the ETFs listed in the above table. Furthermore, they do not represent a specific investment recommendation for you, they merely show which ETFs from the universe I track are falling within the guidelines specified.
Contact Ulli