
- Moving the markets
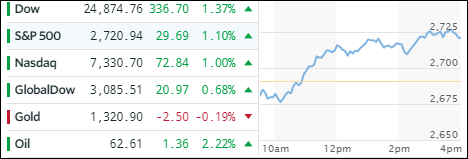
After last week’s drubbing, and an early morning pullback, the major indexes managed a broad-based bounce back with Wall Street traders looking past the trade war rhetoric by focusing on economic data and hope that the sell-off was overdone. Even political uncertainty in Italian elections, where a populist anti-euro party made a better-than-expected showing, couldn’t stop the bulls from flexing their muscles.
Supporting the rally was bargain hunting and short covering with news out of Washington clearly controlling market direction. Sure, we may see more growth and robust earnings, but at the same time we may also have to confront ongoing volatility, caused by hawkish comments and higher rates, which could bring in the downside at anytime.
However, for today it was bullishness across the board with our selected ETFs faring well. Financials (XLF) were the dominator by adding a solid +1.41%. That was followed by the Dividend ETF (DVY +1.22%), MidCaps (SCHM +1.21%) and LargeCaps (SCHX +1.12%).
Interest rates bounced intra-day with the 10-year bond yield adding 2 basis points to close the session at 2.88%. The US Dollar (UUP) vacillated but ended unchanged remaining a tad below its 50-day M/A.
- ETFs in the Spotlight
In case you missed the announcement and description of this section, you can read it here again.
It features 10 broadly diversified and sector ETFs from my HighVolume list as posted every Saturday. Furthermore, they are screened for the lowest MaxDD% number meaning they have been showing better resistance to temporary sell offs than all others over the past year.
The below table simply demonstrates the magnitude with which some of the ETFs are fluctuating in regards to their positions above or below their respective individual trend lines (%M/A). A break below, represented by a negative number, shows weakness, while a break above, represented by a positive percentage, shows strength.
For hundreds of ETF choices, be sure to reference Thursday’s StatSheet.
Year to date, here’s how our candidates have fared so far:
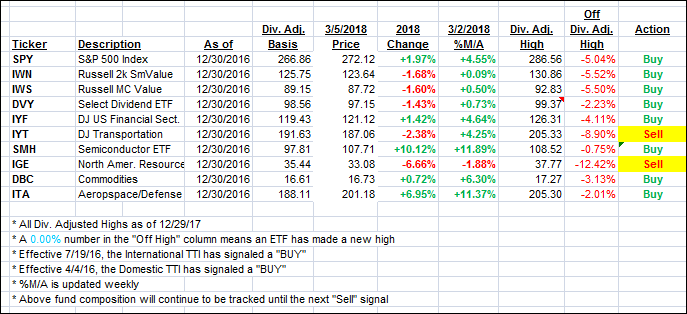
Again, the %M/A column above shows the position of the various ETFs in relation to their respective long term trend lines, while the trailing sell stops are being tracked in the “Off High” column. The “Action” column will signal a “Sell” once the -7.5% point has been taken out in the “Off High” column.
- Trend Tracking Indexes (TTIs)
Our Trend Tracking Indexes (TTIs) joined the rebound and closed higher.
Here’s how we closed 3/05/2018:
Domestic TTI: +2.95% above its M/A (last close +2.54%)—Buy signal effective 4/4/2016
International TTI: +2.36% above its M/A (last close +1.88%)—Buy signal effective 7/19/2016
Disclosure: I am obliged to inform you that I, as well as my advisory clients, own some of the ETFs listed in the above table. Furthermore, they do not represent a specific investment recommendation for you, they merely show which ETFs from the universe I track are falling within the guidelines specified.
Contact Ulli