
- Moving the markets
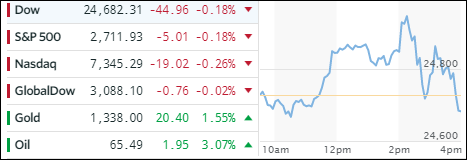
Despite the major indexes gyrating wildly above their respective unchanged lines, ahead of the Fed, in the end, the elevated levels did not hold and we slipped slightly into the red. The big winners after the interest rate hike were Gold and Crude Oil.
There wasn’t really anything in the Fed announcement that was unexpected. Not only were rates hiked by 0.25% as predicted, but additional hikes for 2018 appear to be capped at only 2 more. The only fly in the ointment was the Fed’s upping of its forecast for the number of rate increases it expects in 2019 causing volatility to increase during the remainder of the session.
In ETF land things looked better with most of our broad holdings advancing as only LargeCaps (SCHX) ended up in the red by -0.14%. Leading to the upside were International SmallCaps (SCHC +0.55%), Emerging Markets (SCHE +0.51%) and International ETFs (SCHF +0.24%).
The yield on the 10-year bond went for a wild ride by first rallying towards the 2.93% level, and then dropping sharply to end the day unchanged at 2.89%. The US Dollar (UUP) never got off the ground and took a dive the entire session and lost -0.80%; and that was despite the Fed’s announcement as being of a hawkish nature, which should have been bullish for the dollar. Go figure…
- ETFs in the Spotlight
In case you missed the announcement and description of this section, you can read it here again.
It features 10 broadly diversified and sector ETFs from my HighVolume list as posted every Saturday. Furthermore, they are screened for the lowest MaxDD% number meaning they have been showing better resistance to temporary sell offs than all others over the past year.
The below table simply demonstrates the magnitude with which some of the ETFs are fluctuating in regards to their positions above or below their respective individual trend lines (%M/A). A break below, represented by a negative number, shows weakness, while a break above, represented by a positive percentage, shows strength.
For hundreds of ETF choices, be sure to reference Thursday’s StatSheet.
Year to date, here’s how our candidates have fared so far:
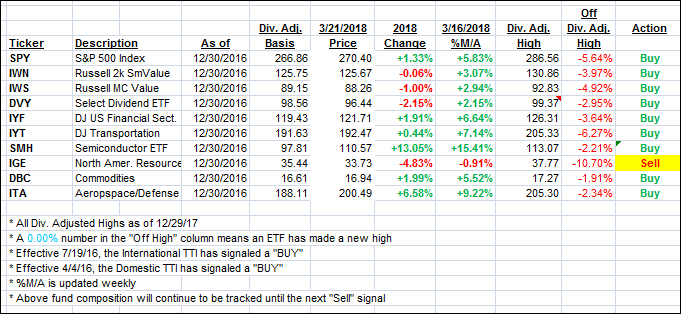
Again, the %M/A column above shows the position of the various ETFs in relation to their respective long term trend lines, while the trailing sell stops are being tracked in the “Off High” column. The “Action” column will signal a “Sell” once the -7.5% point has been taken out in the “Off High” column.
- Trend Tracking Indexes (TTIs)
Our Trend Tracking Indexes (TTIs) were mixed with the Domestic one sliding and the International one advancing.
Here’s how we closed 3/21/2018:
Domestic TTI: +2.71% above its M/A (last close +2.81%)—Buy signal effective 4/4/2016
International TTI: +2.84% above its M/A (last close +2.70%)—Buy signal effective 7/19/2016
Disclosure: I am obliged to inform you that I, as well as my advisory clients, own some of the ETFs listed in the above table. Furthermore, they do not represent a specific investment recommendation for you, they merely show which ETFs from the universe I track are falling within the guidelines specified.
Contact Ulli