
- Moving the markets
I was thinking this morning that something had changed in the markets over the past week or so. All of a sudden, stocks seem to react to day-to-day headline events and no longer consider ‘any’ news as good news for the bullish crowd, which is what we saw throughout 2017.
Supporting a similar view was ZeroHedge with their following comments after today’s market close:
All of a sudden, ‘stuff’ matters:
- Powell hawkish
- Trump lawyer resigns
- Trump trade wars start
- Funding market stress surges
- Credit markets spike
- Facebook new lows
- Tech tax and regulation
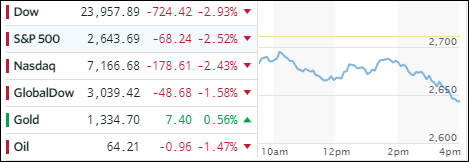
As a result, the markets dumped right after the opening bell and never looked back. Sparking the downturn was the continued threat of a trade war with China, which had been temporarily moved to the back burner, while Facebook’s data harvesting scandal took front and center earlier this week.
To be clear, Facebook’s troubles were persistent in pulling down the tech sector today with the Fed’s interest rate policy and the ongoing game of musical chairs in the White House all combining to the uncertainty in the market place. The fallout was broad with 10 of the 11 S&P sectors ending down for the day, as only utilities managed to buck the trend to gain +0.4%.
Markets pulled back worldwide with especially European stocks having an ugly day, while in China the tech sector was beaten badly. Financials (XLF) went down hard as a result of US and EU banks tumbling. The cost of funding (for corporations) soared, which may have a severe effect on scheduled stock buybacks, which are supposed to be “the” driver for equities this year. These elevated costs may have corporations reconsider the buy-back option.
Interest rates dropped and proved to be a safe haven. The 10-year bond yield gave back 6 basis points to close at 2.83% while the US Dollar (UUP) gained a modest +0.13%.
Our Trend Tracking Indexes (TTIs) dove but remain in bullish territory. For more details, please see section 3 below.
- ETFs in the Spotlight
In case you missed the announcement and description of this section, you can read it here again.
It features 10 broadly diversified and sector ETFs from my HighVolume list as posted every Saturday. Furthermore, they are screened for the lowest MaxDD% number meaning they have been showing better resistance to temporary sell offs than all others over the past year.
The below table simply demonstrates the magnitude with which some of the ETFs are fluctuating in regards to their positions above or below their respective individual trend lines (%M/A). A break below, represented by a negative number, shows weakness, while a break above, represented by a positive percentage, shows strength.
For hundreds of ETF choices, be sure to reference Thursday’s StatSheet.
Year to date, here’s how our candidates have fared so far:
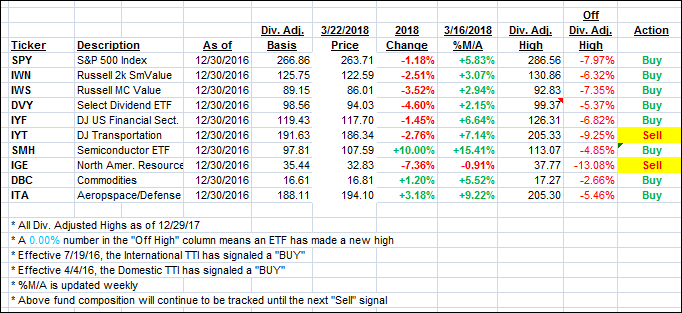
Again, the %M/A column above shows the position of the various ETFs in relation to their respective long term trend lines, while the trailing sell stops are being tracked in the “Off High” column. The “Action” column will signal a “Sell” once the -7.5% point has been taken out in the “Off High” column.
- Trend Tracking Indexes (TTIs)
Our Trend Tracking Indexes (TTIs) joined the markets and headed sharply south with especially the International one taking a steep dive.
Here’s how we closed 3/22/2018:
Domestic TTI: +1.69% above its M/A (last close +2.71%)—Buy signal effective 4/4/2016
International TTI: +0.94% above its M/A (last close +2.84%)—Buy signal effective 7/19/2016
Disclosure: I am obliged to inform you that I, as well as my advisory clients, own some of the ETFs listed in the above table. Furthermore, they do not represent a specific investment recommendation for you, they merely show which ETFs from the universe I track are falling within the guidelines specified.
Contact Ulli