
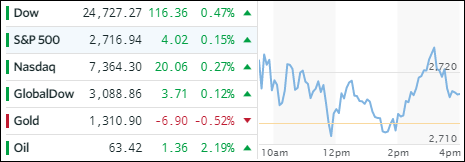
- Moving the markets
Despite continued weakness in Facebook (FB -2.56%), the tech sector as a whole managed to recover from yesterday’s sell-off with QQQ rebounding a modest +0.55%. Supporting action came from the loser YTD, namely the energy sector (XLE), which gained +0.56%.
Facebook’s troubles with privacy violations continue to make headlines but, as I suggested yesterday, these may very well be only company specific issues and not a reflection of the entire technology sector. At least right now it appears that way. UK investigators coined a term describing corporate wrong doings like FB’s malfeasance as “improperly leveraging user data.” It’s hard to put a more positive linguistic spin on that…
The major indexes scored modest gains and so were our ETFs. Leading the pack were Emerging Markets (SCHE +0.96%), Aerospace & Defense (ITA +0.69%) and Semiconductors (SMH +0.68%). The US Dollar (UUP +0.60%) spiked for a change and pushed precious metals down. Interest rates rose with the 10-year bond yield climbing 4 basis points to 2.89%. Much anxiety was present in this arena with the Fed’s announcement on the direction of rates due out tomorrow.
- ETFs in the Spotlight
In case you missed the announcement and description of this section, you can read it here again.
It features 10 broadly diversified and sector ETFs from my HighVolume list as posted every Saturday. Furthermore, they are screened for the lowest MaxDD% number meaning they have been showing better resistance to temporary sell offs than all others over the past year.
The below table simply demonstrates the magnitude with which some of the ETFs are fluctuating in regards to their positions above or below their respective individual trend lines (%M/A). A break below, represented by a negative number, shows weakness, while a break above, represented by a positive percentage, shows strength.
For hundreds of ETF choices, be sure to reference Thursday’s StatSheet.
Year to date, here’s how our candidates have fared so far:
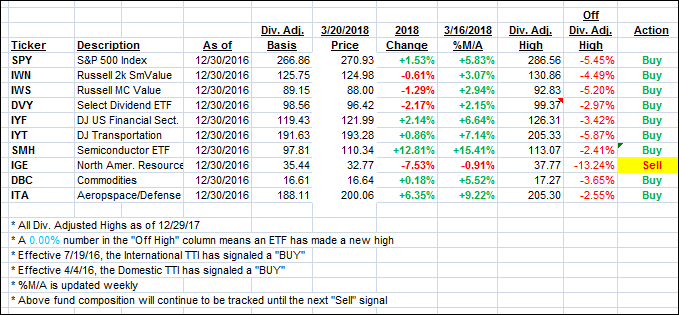
Again, the %M/A column above shows the position of the various ETFs in relation to their respective long term trend lines, while the trailing sell stops are being tracked in the “Off High” column. The “Action” column will signal a “Sell” once the -7.5% point has been taken out in the “Off High” column.
- Trend Tracking Indexes (TTIs)
Our Trend Tracking Indexes (TTIs) recovered with the major indexes staging a small rebound.
Here’s how we closed 3/20/2018:
Domestic TTI: +2.81% above its M/A (last close +2.71%)—Buy signal effective 4/4/2016
International TTI: +2.70% above its M/A (last close +2.52%)—Buy signal effective 7/19/2016
Disclosure: I am obliged to inform you that I, as well as my advisory clients, own some of the ETFs listed in the above table. Furthermore, they do not represent a specific investment recommendation for you, they merely show which ETFs from the universe I track are falling within the guidelines specified.
Contact Ulli