
- Moving the markets
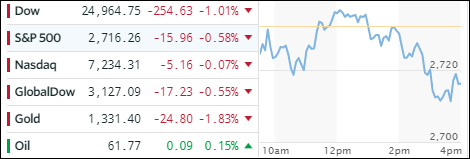
There was nothing exciting about today’s session other than a brief mid-day climb above the unchanged line, after which the major indexes hit the skids with the Dow and S&P snapping a 6-day winning streak. It’s still too early to determine if today’s action was the end of the current dead-cat bounce, as some analysts named last week’s rebound.
Not helping matters or instilling confidence was Wal-Mart’s earnings-related swan dive, which was its biggest one-day decline in 30 years (-10.18%). Yesterday, when the markets were closed for Presidents Day, the futures showed the plunge of the cash market at the open—except there was no opening! Someone forgot to turn off the computers confirming again for those who still don’t know that markets are manipulated and programs will be run as long as the power switch is on.
The VIX headed back above 20, and Treasury yields rose with the 10-year adding 1 basis point to end at +2.91%, its highest level since early 2014. That took any starch out of the mid-day rally attempt. The US Dollar (UUP) turned around and surged +0.64%, seemingly helped by the Chinese New Year Holiday.
- ETFs in the Spotlight
In case you missed the announcement and description of this section, you can read it here again.
It features 10 broadly diversified and sector ETFs from my HighVolume list as posted every Saturday. Furthermore, they are screened for the lowest MaxDD% number meaning they have been showing better resistance to temporary sell offs than all others over the past year.
The below table simply demonstrates the magnitude with which some of the ETFs are fluctuating in regards to their positions above or below their respective individual trend lines (%M/A). A break below, represented by a negative number, shows weakness, while a break above, represented by a positive percentage, shows strength.
For hundreds of ETF choices, be sure to reference Thursday’s StatSheet.
Year to date, here’s how our candidates have fared so far:
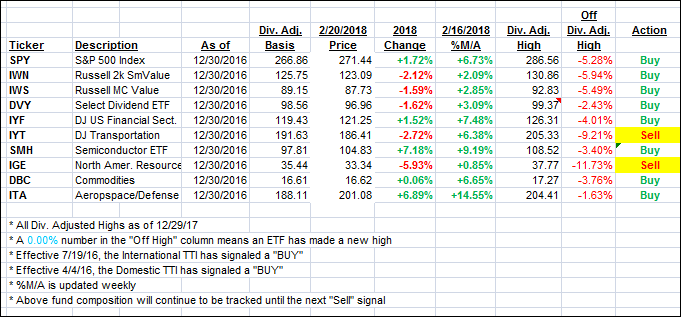
Again, the %M/A column above shows the position of the various ETFs in relation to their respective long term trend lines, while the trailing sell stops are being tracked in the “Off High” column. The “Action” column will signal a “Sell” once the -7.5% point has been taken out in the “Off High” column.
- Trend Tracking Indexes (TTIs)
Our Trend Tracking Indexes (TTIs) dipped as the markets lacked bullish motivation.
Here’s how we closed 2/20/2018:
Domestic TTI: +2.90% above its M/A (last close +3.08%)—Buy signal effective 4/4/2016
International TTI: +3.92% above its M/A (last close +4.40%)—Buy signal effective 7/19/2016
Disclosure: I am obliged to inform you that I, as well as my advisory clients, own some of the ETFs listed in the above table. Furthermore, they do not represent a specific investment recommendation for you, they merely show which ETFs from the universe I track are falling within the guidelines specified.
Contact Ulli
Comments 1
Hey, Uli
How long has it been since you saw a rally that wasn’t a “dead cat bounce?”
Smokey
2/20/18