
- Moving the markets
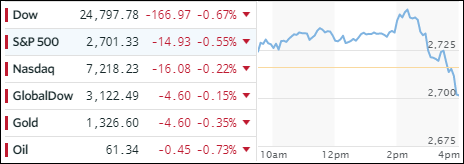
We started today’s session on a positive note when the major indexes suddenly ran into a brick wall, reversed course and headed south with a vengeance with the Dow giving up a 300 point gain and plunging 500 points. The day turned out tumultuous, after the minutes from the Fed were released, causing volatility to rise (VIX back to 20) and giving the bears the upper hand.
The Fed minutes showed that that the economy was strengthening increasing the likelihood of more rates hikes ahead as had been previously assumed. It’s also a sign that inflation worries are justified and a more aggressive hike schedule may be on the horizon increasing borrowing costs not just for corporations but private borrowers as well.
The 10-year bond reacted promptly after the minutes were released, and its yield spiked 6 basis points to close at 2.94%. We’ll now have to see if/when the psychologically important 3% barrier will be broken to the upside and what the effect on equities will be. Benefitting from higher bond yields was the US Dollar (UUP) which, after an opening dump, reversed to close up +0.38%.
None of our trailing sell stops were affected by this 2-day sell-off.
- ETFs in the Spotlight
In case you missed the announcement and description of this section, you can read it here again.
It features 10 broadly diversified and sector ETFs from my HighVolume list as posted every Saturday. Furthermore, they are screened for the lowest MaxDD% number meaning they have been showing better resistance to temporary sell offs than all others over the past year.
The below table simply demonstrates the magnitude with which some of the ETFs are fluctuating in regards to their positions above or below their respective individual trend lines (%M/A). A break below, represented by a negative number, shows weakness, while a break above, represented by a positive percentage, shows strength.
For hundreds of ETF choices, be sure to reference Thursday’s StatSheet.
Year to date, here’s how our candidates have fared so far:
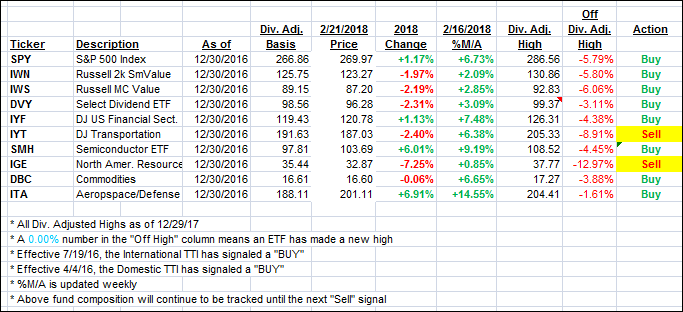
Again, the %M/A column above shows the position of the various ETFs in relation to their respective long term trend lines, while the trailing sell stops are being tracked in the “Off High” column. The “Action” column will signal a “Sell” once the -7.5% point has been taken out in the “Off High” column.
- Trend Tracking Indexes (TTIs)
Our Trend Tracking Indexes (TTIs) continued its modest slide, as a spike in bond yields took the starch out of an early rally.
Here’s how we closed 2/21/2018:
Domestic TTI: +2.80% above its M/A (last close +2.90%)—Buy signal effective 4/4/2016
International TTI: +3.49% above its M/A (last close +3.92%)—Buy signal effective 7/19/2016
Disclosure: I am obliged to inform you that I, as well as my advisory clients, own some of the ETFs listed in the above table. Furthermore, they do not represent a specific investment recommendation for you, they merely show which ETFs from the universe I track are falling within the guidelines specified.
Contact Ulli