
- Moving the markets
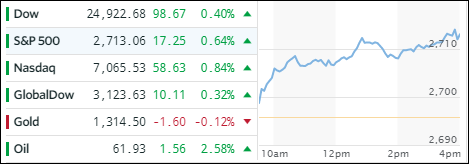
Today, all three major indexes moved in sync by pushing further into uncharted territory and closing at new all-time highs. It was a repeat of yesterday, as we headed straight north right after the opening bell and never looked back with additional momentum gathering strength in the last hour of the session.
The minutes from the last Fed meeting were released and showed some opposing opinions that some characterized as a “distinct lack of unity over the banks 2018 projected rate hikes.” Some members thought that 3 rate hikes to be too aggressive while others considered the proposed pace to be too slow. Despite this fly in the ointment, traders simply dismissed it and focused on continuing to beat the VIX not only into submission but also below the “9” level, its lowest closing ever.
In ETF space, we again saw only green numbers with Semiconductors (SMH) taking the lead for the 2nd day in a row by gaining a solid +1.41%. Emerging Markets (SCHE) took second place with +1.09% followed by International ETFs (SCHF +0.70%) and LargeCaps (SCHX +0.64%). Interest rates dropped with the 10-year yield giving back 2 basis points to end at 2.44%. After a week-long slide, the US Dollar (UUP) finally found some support and rebounded +0.38%, but it’s too early to tell if this is the beginning of new upward momentum or simply another dead cat bounce.
- ETFs in the Spotlight
In case you missed the announcement and description of this section, you can read it here again.
It features 10 broadly diversified and sector ETFs from my HighVolume list as posted every Saturday. Furthermore, they are screened for the lowest MaxDD% number meaning they have been showing better resistance to temporary sell offs than all others over the past year.
The below table simply demonstrates the magnitude with which some of the ETFs are fluctuating in regards to their positions above or below their respective individual trend lines (%M/A). A break below, represented by a negative number, shows weakness, while a break above, represented by a positive percentage, shows strength.
For hundreds of ETF choices, be sure to reference Thursday’s StatSheet.
Year to date, here’s how our candidates have fared so far:
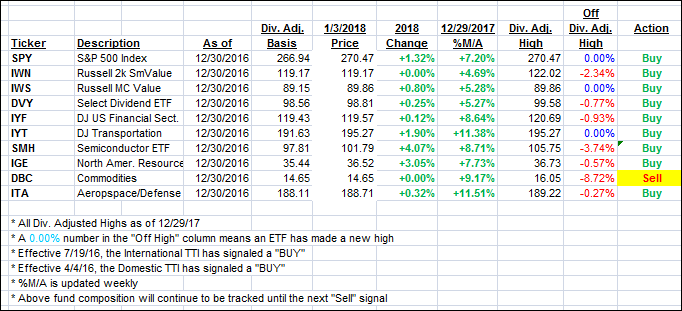
Again, the %M/A column above shows the position of the various ETFs in relation to their respective long term trend lines, while the trailing sell stops are being tracked in the “Off High” column. The “Action” column will signal a “Sell” once the -7.5% point has been taken out in the “Off High” column.
- Trend Tracking Indexes (TTIs)
Our Trend Tracking Indexes (TTIs) headed higher as yesterday’s upward momentum continued unabated.
Here’s how we closed 1/3/2018:
Domestic TTI: +4.15% above its M/A (last close +3.86%)—Buy signal effective 4/4/2016
International TTI: +5.82% above its M/A (last close +5.48%)—Buy signal effective 7/19/2016
Disclosure: I am obliged to inform you that I, as well as my advisory clients, own some of the ETFs listed in the above table. Furthermore, they do not represent a specific investment recommendation for you, they merely show which ETFs from the universe I track are falling within the guidelines specified.
Contact Ulli