
- Moving the markets
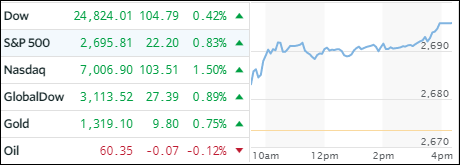
The weak performance of the last day of 2017 is now forgotten, and in the rear view mirror, as the major indexes stormed out of the starting blocks and never looked back. It was the S&P’s and Nasdaq’s turn to set new records while the Dow lagged for the time being. The energy, consumer discretionary and technology sectors dominated by gaining in excess of 1% during the first trading day of 2018.
Market optimism was maintained in ETF space as well, with only green numbers across our holdings. Leading the bunch with a big surge was last year’s favorite, namely Semiconductors (SMH), with a chest pounding advance of +2.62%. This was followed by nice showings of Transportations (IYT +1.79%) and Emerging Markets (SCHE +1.65%). Trailing the group was Financials (XLF) with a meager +0.04%.
Interest rates jumped with the yield on the 10-year bond gaining 6 basis points to 2.46%. That took the starch out of bond prices with the 20-year TLT dropping -1.08%. Gold continued its magic ascent from the beginning of December in a straight line up to close solidly above the $1,300 marker at a level last seen in the middle of September. The US dollar (UUP) was not so lucky and lost another -0.42% to match its lows from 3.5 months ago.
- ETFs in the Spotlight
In case you missed the announcement and description of this section, you can read it here again.
It features 10 broadly diversified and sector ETFs from my HighVolume list as posted every Saturday. Furthermore, they are screened for the lowest MaxDD% number meaning they have been showing better resistance to temporary sell offs than all others over the past year.
The below table simply demonstrates the magnitude with which some of the ETFs are fluctuating in regards to their positions above or below their respective individual trend lines (%M/A). A break below, represented by a negative number, shows weakness, while a break above, represented by a positive percentage, shows strength.
For hundreds of ETF choices, be sure to reference Thursday’s StatSheet.
Year to date, here’s how our candidates have fared so far:
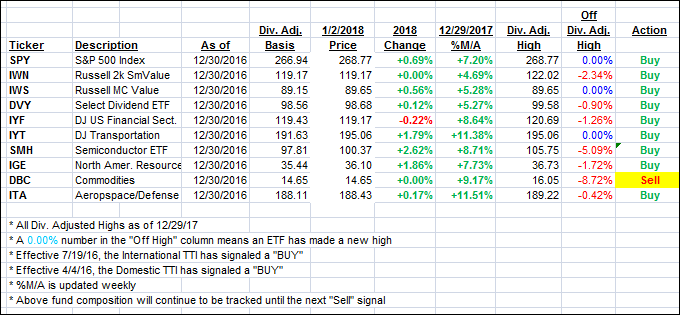
Again, the %M/A column above shows the position of the various ETFs in relation to their respective long term trend lines, while the trailing sell stops are being tracked in the “Off High” column. The “Action” column will signal a “Sell” once the -7.5% point has been taken out in the “Off High” column.
- Trend Tracking Indexes (TTIs)
Our Trend Tracking Indexes (TTIs) gained as the major indexes started the New Year out with a bang.
Here’s how we closed 1/2/2018:
Domestic TTI: +3.86% above its M/A (last close +3.50%)—Buy signal effective 4/4/2016
International TTI: +5.48% above its M/A (last close +4.80%)—Buy signal effective 7/19/2016
Disclosure: I am obliged to inform you that I, as well as my advisory clients, own some of the ETFs listed in the above table. Furthermore, they do not represent a specific investment recommendation for you, they merely show which ETFs from the universe I track are falling within the guidelines specified.
Contact Ulli