
- Moving the markets
Things looked pretty hunky dory after the opening with the major indexes storming again into record territory. Then the hammer came down in form of Commerce Secretary Ross’s comments. Bloomberg reported as follows:
- ROSS: CHINA `SUPERB’ TALKING FREE TRADE, ACTING PROTECTIONIST
- ROSS: STEEL FORUM HAS MADE `ZERO DIFFERENCE’ FOR OVERCAPACITY
- ROSS: CHINA IS EXPORTING MORE STEEL THAN U.S. HAS IN CAPACITY
- COMMERCE’S ROSS: CHINESE IP REPORT WILL STILL `BE LITTLE WHILE’
- ROSS: IT WAS NO ACCIDENT THAT U.S. DIDN’T DROP TTIP W/ EUROPE
- ROSS: THERE’S GROWING RECOGNITION OF ACCUMULATED TRADE RISKS
That was enough to send the indexes reeling below the unchanged line. The afternoon rebound attempt limited the downside damage, but the Nasdaq fell short of getting back to green numbers. Sure, some exhaustion may have set in as well with equities having been on a non-stop run this year in addition to the substantial gains of 2017.
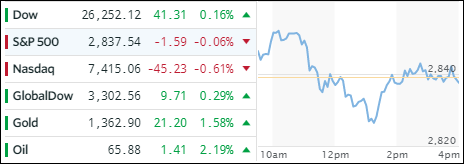
Today’s whip-saw left a mark in the ETF space as well, where losers outpaced winners. Semiconductors (SMH) came off its torrid pace and surrendered -2.03%. Transportations (IYT -1.44%) followed suit and to a lesser degree SmallCaps (SCHA -0.45%). On the plus side, we saw Emerging Market (SCHE) leading with +0.89%, joined by the Financials (XLF +0.67%) and Aerospace & Defense (ITA +0.54%).
Interest rates headed higher again with 10-year bond yield gaining 2 basis points to 2.65%. Continuing the bullish theme was oil and gold, while the US Dollar (UUP) was taken out to barn and spanked at the tune of -0.98%, its lowest price since November 2014. In the past 12 months, UUP has now lost -13%.
- ETFs in the Spotlight
In case you missed the announcement and description of this section, you can read it here again.
It features 10 broadly diversified and sector ETFs from my HighVolume list as posted every Saturday. Furthermore, they are screened for the lowest MaxDD% number meaning they have been showing better resistance to temporary sell offs than all others over the past year.
The below table simply demonstrates the magnitude with which some of the ETFs are fluctuating in regards to their positions above or below their respective individual trend lines (%M/A). A break below, represented by a negative number, shows weakness, while a break above, represented by a positive percentage, shows strength.
For hundreds of ETF choices, be sure to reference Thursday’s StatSheet.
Year to date, here’s how our candidates have fared so far:
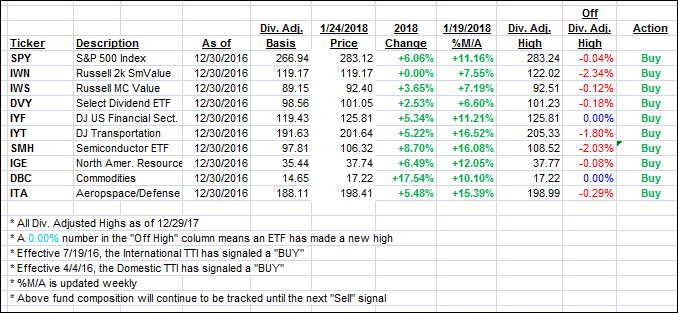
Again, the %M/A column above shows the position of the various ETFs in relation to their respective long term trend lines, while the trailing sell stops are being tracked in the “Off High” column. The “Action” column will signal a “Sell” once the -7.5% point has been taken out in the “Off High” column.
- Trend Tracking Indexes (TTIs)
Our Trend Tracking Indexes (TTIs) slipped as an early rally petered out.
Here’s how we closed 1/24/2018:
Domestic TTI: +5.27% above its M/A (last close +5.44%)—Buy signal effective 4/4/2016
International TTI: +9.43% above its M/A (last close +9.50%)—Buy signal effective 7/19/2016
Disclosure: I am obliged to inform you that I, as well as my advisory clients, own some of the ETFs listed in the above table. Furthermore, they do not represent a specific investment recommendation for you, they merely show which ETFs from the universe I track are falling within the guidelines specified.
Contact Ulli