
- Moving the markets
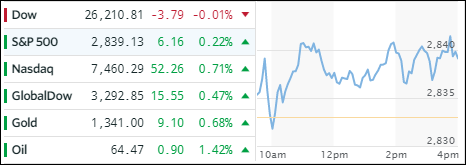
Two of the three major indexes stormed into record territory again after upbeat earnings boosted investor sentiment, and the bulls shifted into overdrive ignoring the Dow’s weakness. Helping matters was Netflix’s rally, as it topped the $100 million market cap. Also throwing in an assist was the ending of the government shutdown, although Congress only passed a 3-week funding measure, AKA: we solved nothing but merely kicked the can down the road.
Be that as it may, green numbers prevailed and the ETF space benefited as well. Closing to the upside were Semiconductors (SMH) with +0.65% with MidCaps (SCHM +0.39%) and Emerging Markets (SCHE +0.39%) following closely behind. Giving back some of their recent gains were Aerospace & Defense (ITA -0.33%) and the Dividend ETF (SCHD -0.24%).
Interest rates took a breather today with the 10-year bond yield declining 3 basis points to 2.63%. Gold and Crude oil advanced but the US Dollar UUUP), which has been in bearish territory since last May, took another -0.25% dive to close at its lowest since December 2014.
- ETFs in the Spotlight
In case you missed the announcement and description of this section, you can read it here again.
It features 10 broadly diversified and sector ETFs from my HighVolume list as posted every Saturday. Furthermore, they are screened for the lowest MaxDD% number meaning they have been showing better resistance to temporary sell offs than all others over the past year.
The below table simply demonstrates the magnitude with which some of the ETFs are fluctuating in regards to their positions above or below their respective individual trend lines (%M/A). A break below, represented by a negative number, shows weakness, while a break above, represented by a positive percentage, shows strength.
For hundreds of ETF choices, be sure to reference Thursday’s StatSheet.
Year to date, here’s how our candidates have fared so far:
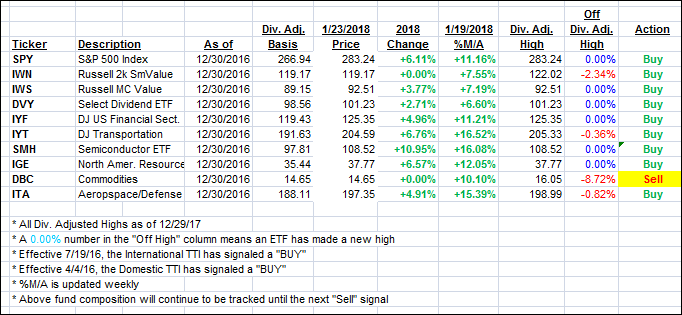
Again, the %M/A column above shows the position of the various ETFs in relation to their respective long term trend lines, while the trailing sell stops are being tracked in the “Off High” column. The “Action” column will signal a “Sell” once the -7.5% point has been taken out in the “Off High” column.
- Trend Tracking Indexes (TTIs)
Our Trend Tracking Indexes (TTIs) edged higher as the bulls were clearly in charge.
Here’s how we closed 1/23/2018:
Domestic TTI: +5.44% above its M/A (last close +5.29%)—Buy signal effective 4/4/2016
International TTI: +9.50% above its M/A (last close +9.17%)—Buy signal effective 7/19/2016
Disclosure: I am obliged to inform you that I, as well as my advisory clients, own some of the ETFs listed in the above table. Furthermore, they do not represent a specific investment recommendation for you, they merely show which ETFs from the universe I track are falling within the guidelines specified.
Contact Ulli