
- Moving the markets
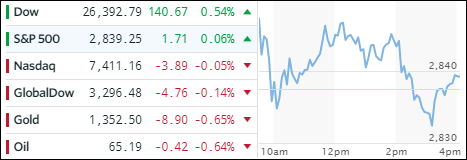
Treasury secretary Mnuchin’s remarks pushed the dollar (UUP) even lower, but in the end, the day was saved by President Trump stepping in with the soothing words that Mnuchin’s statement was taken out of context and a long-term strong dollar policy was still the administration’s goal. This pumped the dollar back up, after the early dump, but it was only enough to hang on to a tiny gain of +0.13%.
On the equity side, we saw a roller coaster ride with the Nasdaq slipping a tad, but the Dow and S&P managed not only to eke out small gains but set new records as well. Still, market activity was predominantly sideways, which carried over to the ETF space as well giving us a mixed showing.
On the plus side, Aerospace & Defense (ITA) showed a solid performance with a gain of +1.50%. Distant followers were the Dividend ETF (SCHD +0.17%) and LargeCaps (SCHX +0.04%). Giving back some of their recent advances were Semiconductors (SMH -1.62%), Transportations (IYT -1.57%) and International SmallCaps (SCHC -0.44%). Interest rates dropped allowing the 20-year bond (TLT) to stage a nice rally by gaining +0.82%.
- ETFs in the Spotlight
In case you missed the announcement and description of this section, you can read it here again.
It features 10 broadly diversified and sector ETFs from my HighVolume list as posted every Saturday. Furthermore, they are screened for the lowest MaxDD% number meaning they have been showing better resistance to temporary sell offs than all others over the past year.
The below table simply demonstrates the magnitude with which some of the ETFs are fluctuating in regards to their positions above or below their respective individual trend lines (%M/A). A break below, represented by a negative number, shows weakness, while a break above, represented by a positive percentage, shows strength.
For hundreds of ETF choices, be sure to reference Thursday’s StatSheet.
Year to date, here’s how our candidates have fared so far:
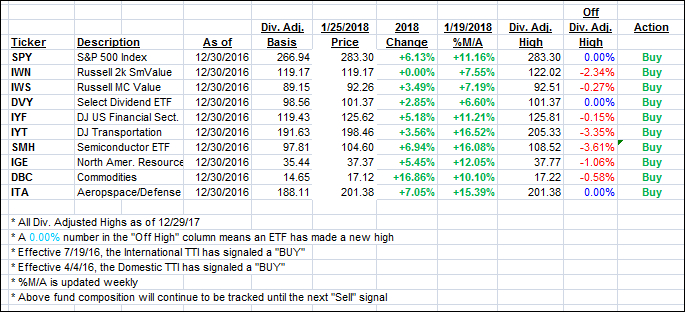
Again, the %M/A column above shows the position of the various ETFs in relation to their respective long term trend lines, while the trailing sell stops are being tracked in the “Off High” column. The “Action” column will signal a “Sell” once the -7.5% point has been taken out in the “Off High” column.
- Trend Tracking Indexes (TTIs)
Our Trend Tracking Indexes (TTIs) slipped a tad as a sideways pattern dominated.
Here’s how we closed 1/25/2018:
Domestic TTI: +5.26% above its M/A (last close +5.27%)—Buy signal effective 4/4/2016
International TTI: +9.22% above its M/A (last close +9.43%)—Buy signal effective 7/19/2016
Disclosure: I am obliged to inform you that I, as well as my advisory clients, own some of the ETFs listed in the above table. Furthermore, they do not represent a specific investment recommendation for you, they merely show which ETFs from the universe I track are falling within the guidelines specified.
Contact Ulli