
- Moving the markets
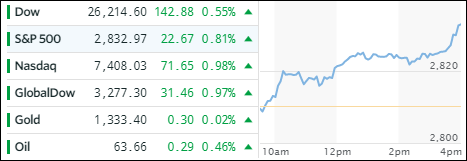
It does not seem to matter what the news is, it’s all good for the markets. Friday’s fear of a looming government shutdown elevated the major indexes into record territory. Today’s announcement that the Senate moved to end the shutdown only 3 days later caused the markets to continue their record setting pace following the historic lesson that shutdowns don’t effect equities.
Of course, as trend followers we don’t really care what moves the markets only that they maintain their bullish course as measured by our Trend Tracking Indexes. Today’s action supported our cause as the ETF space was positively affected. Only Aerospace & Defense (ITA) dropped a tad and lost -0.41%. On the plus side, we saw Semiconductors (SMH) leading with +0.98% followed by Emerging Markets (SCHE +0.93%) and US LargeCaps (SCHX +0.84%).
Interest rates rose with the 10-year bond yield jumping 2 basis points to 2.66%. The US Dollar (UUP) round-tripped several times but failed to hang on any gains and slumped into the close losing -0.34%.
- ETFs in the Spotlight
In case you missed the announcement and description of this section, you can read it here again.
It features 10 broadly diversified and sector ETFs from my HighVolume list as posted every Saturday. Furthermore, they are screened for the lowest MaxDD% number meaning they have been showing better resistance to temporary sell offs than all others over the past year.
The below table simply demonstrates the magnitude with which some of the ETFs are fluctuating in regards to their positions above or below their respective individual trend lines (%M/A). A break below, represented by a negative number, shows weakness, while a break above, represented by a positive percentage, shows strength.
For hundreds of ETF choices, be sure to reference Thursday’s StatSheet.
Year to date, here’s how our candidates have fared so far:
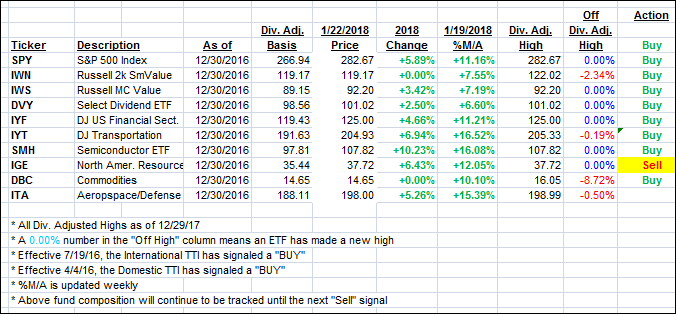
Again, the %M/A column above shows the position of the various ETFs in relation to their respective long term trend lines, while the trailing sell stops are being tracked in the “Off High” column. The “Action” column will signal a “Sell” once the -7.5% point has been taken out in the “Off High” column.
- Trend Tracking Indexes (TTIs)
Our Trend Tracking Indexes (TTIs) moved higher as the major indexes set new records.
Here’s how we closed 1/22/2018:
Domestic TTI: +5.29% above its M/A (last close +5.04%)—Buy signal effective 4/4/2016
International TTI: +9.17% above its M/A (last close +8.52%)—Buy signal effective 7/19/2016
Disclosure: I am obliged to inform you that I, as well as my advisory clients, own some of the ETFs listed in the above table. Furthermore, they do not represent a specific investment recommendation for you, they merely show which ETFs from the universe I track are falling within the guidelines specified.
Contact Ulli