
- Moving the Markets
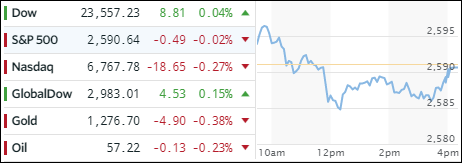
Weighing on the major indexes was a sell-off in predominantly three sectors, which kept a lid on the usual afternoon ramp. Retail (XRT), Financials (XLF) and SmallCaps (SCHA) combined their poor performances of -2.35%, -1.38% and -1.10% respectively to keep any upward momentum from gaining speed—and they succeeded with only the Dow eking out a tiny gain to again sneak into record territory.
Again, tax talk was on the table, and anxiety prevailed as to whether, how and when some policy might be enacted. For sure, equities will be vulnerable should a tax bill have trouble passing. Given how far stocks have risen on account of a potential major tax reform, today’s retreat is hardly worth mentioning.
In ETF space, green numbers were hard to find with the Dividend ETF (SCHD) being the exception with a gain of +0.25%. All of our other holdings slipped led by Financials (XLF) with -1.38% and followed by SmallCaps (SCHA) with -1.10% and Transportations (IYT) with -0.69%.
Interest rates were mixed with the 10-year bond yield remaining unchanged, but the price of the 20-year bond (TLT) rallied +0.42%. High yield bonds (HYG) slipped in price -0.28% and at the same time dropped below their 50-day M/A. High yield bonds can at times be the canary in the coal mine by pointing to the future direction of interest rates, which may give a clue as to where equities might be headed. That’s important because if high yield bonds collapse, interest rates will rise and equities may head south.
- ETFs in the Spotlight (updated for 2017)
In case you missed the announcement and description of this section, you can read it here again.
It features 10 broadly diversified and sector ETFs from my HighVolume list as posted every Saturday. Furthermore, they are screened for the lowest MaxDD% number meaning they have been showing better resistance to temporary sell offs than all others over the past year.
The below table simply demonstrates the magnitude with which some of the ETFs are fluctuating in regards to their positions above or below their respective individual trend lines (%M/A). A break below, represented by a negative number, shows weakness, while a break above, represented by a positive percentage, shows strength.
For hundreds of ETF choices, be sure to reference Thursday’s StatSheet.
Year to date, here’s how the 2017 candidates have fared so far:
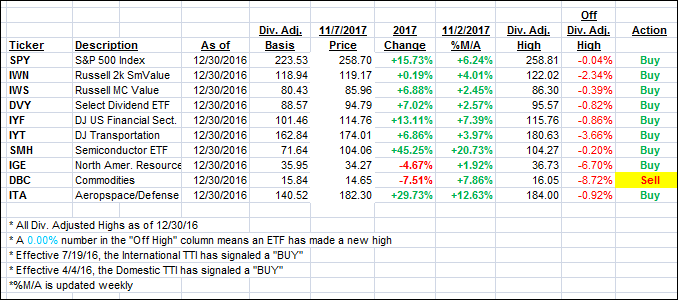
Again, the %M/A column above shows the position of the various ETFs in relation to their respective long term trend lines, while the trailing sell stops are being tracked in the “Off High” column. The “Action” column will signal a “Sell” once the -7.5% point has been taken out in the “Off High” column.
- Trend Tracking Indexes (TTIs)
Our Trend Tracking Indexes (TTIs) slipped as markets were mixed.
Here’s how we closed 11/7/2017:
Domestic TTI: +3.25% (last close +3.31%)—Buy signal effective 4/4/2016
International TTI: +6.37% (last close +6.69%)—Buy signal effective 7/19/2016
Disclosure: I am obliged to inform you that I, as well as my advisory clients, own some of the ETFs listed in the above table. Furthermore, they do not represent a specific investment recommendation for you, they merely show which ETFs from the universe I track are falling within the guidelines specified.
Contact Ulli