
- Moving the Markets
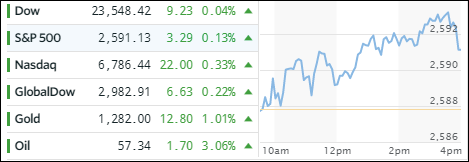
The weekend news simply did not matter. Saudi Arabia went into crisis mode after 2 of their princes died, one via a helicopter crash and the other one in a firefight to avoid arrest, dozens were taken into custody, assets were frozen and a no-fly zone for private planes was invoked. Domestically, McCain called the new tax deal DOA and—the major indexes rallied to new highs, which marked the 26th time this year that simultaneous records have been set.
At least one asset class reacted as it should, namely gold, which added over 1%. Maybe that’s a reflection that some traders finally reached out for a safe haven asset. Of course, as was to be expected, turmoil on the Middle East always affects crude oil, and today was no exception as the black gold rallied over 3%.
In ETF space, Semiconductors (SMH) kept the bullish momentum going by jumping +1.29% with Emerging Markets (SCHE) having a great showing as well with a gain of +1.05%. On the downside, we saw the Dividend ETF (SCHD) and Transportations (IYT) surrender -0.31% and -0.26% respectively.
Interest rates dropped as the yield on the 10-year bond gave back 2 basis points to end the session at 2.32%. That is only 1 point above its 200-day M/A which, if clearly broken to the downside, could mean lower rates ahead. The US Dollar (UUP) tumbled today by -0.24% erasing its recent gains.
- ETFs in the Spotlight (updated for 2017)
In case you missed the announcement and description of this section, you can read it here again.
It features 10 broadly diversified and sector ETFs from my HighVolume list as posted every Saturday. Furthermore, they are screened for the lowest MaxDD% number meaning they have been showing better resistance to temporary sell offs than all others over the past year.
The below table simply demonstrates the magnitude with which some of the ETFs are fluctuating in regards to their positions above or below their respective individual trend lines (%M/A). A break below, represented by a negative number, shows weakness, while a break above, represented by a positive percentage, shows strength.
For hundreds of ETF choices, be sure to reference Thursday’s StatSheet.
Year to date, here’s how the 2017 candidates have fared so far:
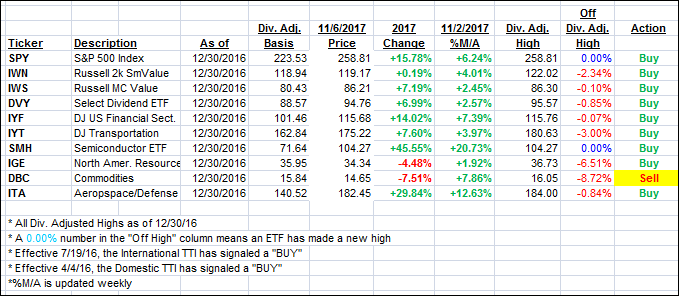
Again, the %M/A column above shows the position of the various ETFs in relation to their respective long term trend lines, while the trailing sell stops are being tracked in the “Off High” column. The “Action” column will signal a “Sell” once the -7.5% point has been taken out in the “Off High” column.
- Trend Tracking Indexes (TTIs)
Our Trend Tracking Indexes (TTIs) headed north by a small margin.
Here’s how we closed 11/6/2017:
Domestic TTI: +3.31% (last close +3.27%)—Buy signal effective 4/4/2016
International TTI: +6.69% (last close +6.58%)—Buy signal effective 7/19/2016
Disclosure: I am obliged to inform you that I, as well as my advisory clients, own some of the ETFs listed in the above table. Furthermore, they do not represent a specific investment recommendation for you, they merely show which ETFs from the universe I track are falling within the guidelines specified.
Contact Ulli