
- Moving the Markets
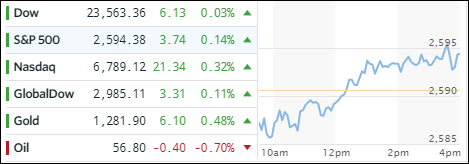
It appears that we’re back to normal—the new normal that is. I am talking about the pattern we’ve come to know very well this year. Namely, a weak opening followed by a mid-day bounce and a strong finish accompanied by new all-time highs. That’s exactly what we got, as the major indexes scored simultaneous records on the same day for the 27th time this year.
Hope prevailed that market fundamentals are justified (they’re not), the economy is expanding (very questionable if you look at record retail store closings) and that Trump will deliver on his tax cuts (no assurances). However, none of these concerns matter as long as there is hope, the markets will take that as a positive. However, just in case that wasn’t enough, the VIX was crushed below 10 again to ensure a green closing.
In ETF space, we saw mainly green numbers. Leading the pack was Emerging Markets (SCHE) with +0.51% joined by International SmallCaps (SCHC) and International Equities (SCHF) with gains of +0.36% and +0.35% respectively. Financials (XLF) headed south by giving back -0.49% along with Transportations (IYT) losing -0.39%.
Interest rates were unchanged but High Yield bonds (HYG) continued to slump by not only losing another -0.44% but also hovering now below their 50-day M/A. We’ll have to wait and see if this is just an outlier or a precursor of things to come in regards to higher rates.
- ETFs in the Spotlight (updated for 2017)
In case you missed the announcement and description of this section, you can read it here again.
It features 10 broadly diversified and sector ETFs from my HighVolume list as posted every Saturday. Furthermore, they are screened for the lowest MaxDD% number meaning they have been showing better resistance to temporary sell offs than all others over the past year.
The below table simply demonstrates the magnitude with which some of the ETFs are fluctuating in regards to their positions above or below their respective individual trend lines (%M/A). A break below, represented by a negative number, shows weakness, while a break above, represented by a positive percentage, shows strength.
For hundreds of ETF choices, be sure to reference Thursday’s StatSheet.
Year to date, here’s how the 2017 candidates have fared so far:
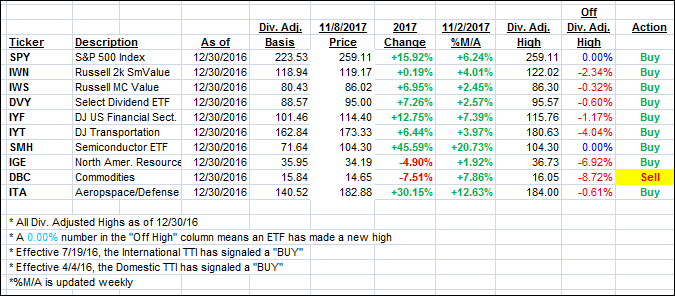
Again, the %M/A column above shows the position of the various ETFs in relation to their respective long term trend lines, while the trailing sell stops are being tracked in the “Off High” column. The “Action” column will signal a “Sell” once the -7.5% point has been taken out in the “Off High” column.
- Trend Tracking Indexes (TTIs)
Our Trend Tracking Indexes (TTIs) headed higher as new records were set.
Here’s how we closed 11/8/2017:
Domestic TTI: +3.35% (last close +3.25%)—Buy signal effective 4/4/2016
International TTI: +6.52% (last close +6.37%)—Buy signal effective 7/19/2016
Disclosure: I am obliged to inform you that I, as well as my advisory clients, own some of the ETFs listed in the above table. Furthermore, they do not represent a specific investment recommendation for you, they merely show which ETFs from the universe I track are falling within the guidelines specified.
Contact Ulli