
- Moving the Markets
Despite the Fed’s minutes from its September meeting, including words of caution among policy makers in regards to the next interest rate hike, market odds spiked that the widely expected December hike would materialize. Further notes indicated that it might take longer than anticipated to get inflation back to the Fed’s 2% target, and so on…
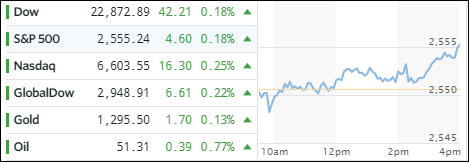
While the three major indexes were stuck at the unchanged line leading up to the release of the FOMC minutes, in the end, it was up, up and away as we levitated into record territory—again. It’s all based on hope, as odds of Trump’s tax reform are decreasing with the “Corker feud” continuing in full swing.
ETFs had a good day with most of our holdings closing in the green. Heading the pack to the upside were Semicondcuctors (SMH) with +0.71% while International Equities (SCHF) and Transportations (IYT) showed solid gains with +0.44% and +0.41% respectively. Sporting red numbers on the session were Aerospace & Defense (ITA) and US SmallCaps (SCHA) with modest losses of -0.26% and -0.03%.
Treasury yields fell again with the 10-year giving back 2 basis points to end the day at 2.35%. Gold continued its recovery, while the US dollar (UUP) extended its losses by giving back -0.29%.
- ETFs in the Spotlight (updated for 2017)
In case you missed the announcement and description of this section, you can read it here again.
It features 10 broadly diversified and sector ETFs from my HighVolume list as posted every Saturday. Furthermore, they are screened for the lowest MaxDD% number meaning they have been showing better resistance to temporary sell offs than all others over the past year.
The below table simply demonstrates the magnitude with which some of the ETFs are fluctuating in regards to their positions above or below their respective individual trend lines (%M/A). A break below, represented by a negative number, shows weakness, while a break above, represented by a positive percentage, shows strength.
For hundreds of ETF choices, be sure to reference Thursday’s StatSheet.
Year to date, here’s how the 2017 candidates have fared so far:
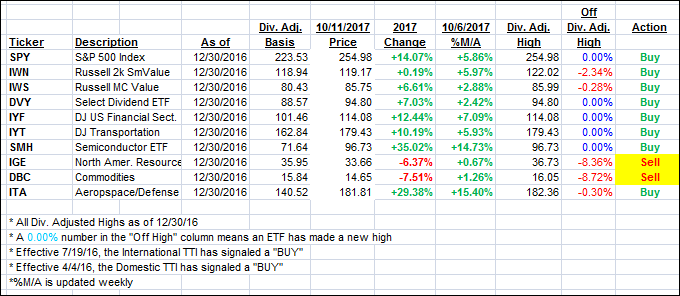
Again, the %M/A column above shows the position of the various ETFs in relation to their respective long term trend lines, while the trailing sell stops are being tracked in the “Off High” column. The “Action” column will signal a “Sell” once the -7.5% point has been taken out in the “Off High” column.
- Trend Tracking Indexes (TTIs)
Our Trend Tracking Indexes (TTIs) inched higher as the rally continued.
Here’s how we closed 10/11/2017:
Domestic TTI: +3.17% (last close +3.09%)—Buy signal effective 4/4/2016
International TTI: +7.44% (last close +7.18%)—Buy signal effective 7/19/2016
Disclosure: I am obliged to inform you that I, as well as my advisory clients, own some of the ETFs listed in the above table. Furthermore, they do not represent a specific investment recommendation for you, they merely show which ETFs from the universe I track are falling within the guidelines specified.
Contact Ulli