
- Moving the Markets
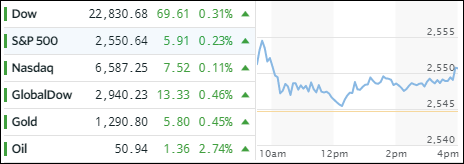
And the beat goes on. The major indexes shot up right after the opening bell, retreated during mid-day and rallied into the close but with only the Dow managing to squeeze out another record; its 47th for 2017. A big assist came from Walmart (WMT), which gained +4.43% on the day and produced the biggest boost on the Dow.
In ETF space, green was the dominant number with Emerging Markets (SCHE) being the leader with a gain of +0.99%, which was closely followed by International SmallCaps (SCHC) adding +0.95% and International Equities (SCHF) logging in +0.84%. The only red we saw was with Aerospace & Defense (ITA), which surrendered a negligible -0.04%.
The 10-year yield pulled back 2 basis points to close at 2.35%. Gold and crude oil popped while the US dollar (UUP) dropped (-0.53%). UUP is now in danger of breaking its 50-day M/A to the downside, which would mean a resumption of the bearish trend.
The main focus for the remainder of this week will be the release of the FOMC minutes from the September meeting. As always, should the interpretation be more hawkish (higher rates) than assumed, increased volatility may visit equity markets again. The other focal point will be the beginning of third quarter earnings season, and we will find out if the current elevated prices of equities are justified.
- ETFs in the Spotlight (updated for 2017)
In case you missed the announcement and description of this section, you can read it here again.
It features 10 broadly diversified and sector ETFs from my HighVolume list as posted every Saturday. Furthermore, they are screened for the lowest MaxDD% number meaning they have been showing better resistance to temporary sell offs than all others over the past year.
The below table simply demonstrates the magnitude with which some of the ETFs are fluctuating in regards to their positions above or below their respective individual trend lines (%M/A). A break below, represented by a negative number, shows weakness, while a break above, represented by a positive percentage, shows strength.
For hundreds of ETF choices, be sure to reference Thursday’s StatSheet.
Year to date, here’s how the 2017 candidates have fared so far:
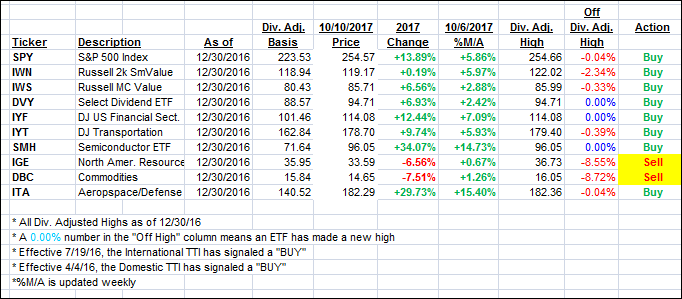
Again, the %M/A column above shows the position of the various ETFs in relation to their respective long term trend lines, while the trailing sell stops are being tracked in the “Off High” column. The “Action” column will signal a “Sell” once the -7.5% point has been taken out in the “Off High” column.
- Trend Tracking Indexes (TTIs)
Our Trend Tracking Indexes (TTIs) moved higher as the bullish theme resumed.
Here’s how we closed 10/10/2017:
Domestic TTI: +3.09% (last close +3.03%)—Buy signal effective 4/4/2016
International TTI: +7.18% (last close +6.85%)—Buy signal effective 7/19/2016
Disclosure: I am obliged to inform you that I, as well as my advisory clients, own some of the ETFs listed in the above table. Furthermore, they do not represent a specific investment recommendation for you, they merely show which ETFs from the universe I track are falling within the guidelines specified.
Contact Ulli