
- Moving the Markets
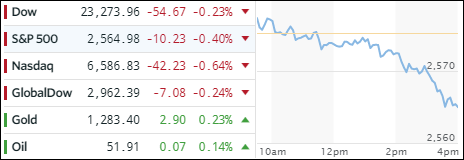
It had to happen eventually. The winning streak came to an end today, as uncertainty reigned in regards to tax cuts and corporate earnings, of which some 200 S&P companies are scheduled to report this week. Of course, given current market levels, we are way overdue for a pause.
Interestingly, the markets did not find any footing during the session, as we have become accustomed to, and ended up closing at the lows for the day. As ZH reports, it has now been 242 days since the US equity market has dipped by 3% or more… a new dubious all-time record, and to me another confirmation that markets are manipulated. As far as today is concerned, stocks had their worst outing in 6 weeks.
Despite the major indexes slipping, we saw some green numbers in ETF space. Gaining the most was our winner YTD, namely Semiconductors (SMH), which managed to buck the Nasdaq’s downtrend by gaining +0.38%. Divided ETFs (SCHD) also closed on the positive side with +0.08%. However, red numbers were dominant with Emerging Markets (SCHE) giving back -0.80%, while Aerospace & Defense (ITA) and SmallCaps retreated -0.70% and -0.67% respectively.
The yield on the 10-year bond ended up dropping 1 basis point to 2.38% after having tested higher ground all day, namely the 2.40% level. Gold was lower for most of the session, then suddenly spiked and managed to reclaim its 100 day M/A level. The US dollar (UUP) rallied but faded into the close with a tiny gain of +0.12%.
- ETFs in the Spotlight (updated for 2017)
In case you missed the announcement and description of this section, you can read it here again.
It features 10 broadly diversified and sector ETFs from my HighVolume list as posted every Saturday. Furthermore, they are screened for the lowest MaxDD% number meaning they have been showing better resistance to temporary sell offs than all others over the past year.
The below table simply demonstrates the magnitude with which some of the ETFs are fluctuating in regards to their positions above or below their respective individual trend lines (%M/A). A break below, represented by a negative number, shows weakness, while a break above, represented by a positive percentage, shows strength.
For hundreds of ETF choices, be sure to reference Thursday’s StatSheet.
Year to date, here’s how the 2017 candidates have fared so far:
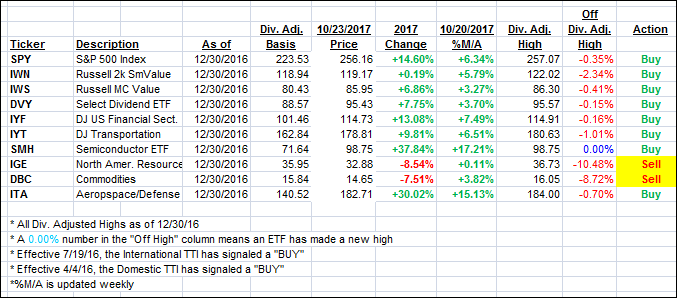
Again, the %M/A column above shows the position of the various ETFs in relation to their respective long term trend lines, while the trailing sell stops are being tracked in the “Off High” column. The “Action” column will signal a “Sell” once the -7.5% point has been taken out in the “Off High” column.
- Trend Tracking Indexes (TTIs)
Our Trend Tracking Indexes (TTIs) slipped as the major indexes pulled off their highs in unison.
Here’s how we closed 10/23/2017:
Domestic TTI: +2.73% (last close +2.86%)—Buy signal effective 4/4/2016
International TTI: +6.32% (last close +6.48%)—Buy signal effective 7/19/2016
Disclosure: I am obliged to inform you that I, as well as my advisory clients, own some of the ETFs listed in the above table. Furthermore, they do not represent a specific investment recommendation for you, they merely show which ETFs from the universe I track are falling within the guidelines specified.
Contact Ulli