
- Moving the Markets
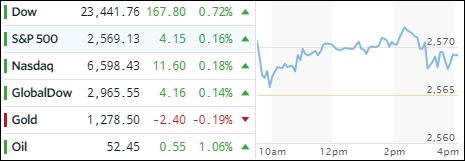
The Dow got a huge assist today from Caterpillar (CAT) and 3M, which jumped after showing a better than expected quarterly report card. Both components contributed some 150 points to the Dow’s 168 point gain—into record territory. It was a narrow advance with Healthcare (XLV) bucking the overall positive trend (-0.56%) thereby limiting broad participation.
Things got a little chaotic late in the session as headline news broke about senators Flake, McCain and Paul apparently standing in the way of Trump’s tax plan, the positive outcome of which is still questionable but has been the basis of the recent market advances. Nevertheless, the affect on equities was only minor—so far.
The color green was prevalent across all of our ETF holdings, and the gains were steady but not spectacular due to the S&P 500 and Nasdaq lagging the Dow. Leading the bunch were Semiconductors (SMH) and International SmallCaps (SCHC), which gained +0.61% and +0.28% respectively. On the bottom of the totem pole, we saw the Dividend ETF (SCHD) and Aerospace & Defense (ITA) adding +0.12% and +0.13%.
Interest rates rose with the 10-year bond yield climbing to break the 2.40% level, which we saw last in April. Crude oil settled above the $52 marker and the US dollar see-sawed but ended the day up by +0.16%.
- ETFs in the Spotlight (updated for 2017)
In case you missed the announcement and description of this section, you can read it here again.
It features 10 broadly diversified and sector ETFs from my HighVolume list as posted every Saturday. Furthermore, they are screened for the lowest MaxDD% number meaning they have been showing better resistance to temporary sell offs than all others over the past year.
The below table simply demonstrates the magnitude with which some of the ETFs are fluctuating in regards to their positions above or below their respective individual trend lines (%M/A). A break below, represented by a negative number, shows weakness, while a break above, represented by a positive percentage, shows strength.
For hundreds of ETF choices, be sure to reference Thursday’s StatSheet.
Year to date, here’s how the 2017 candidates have fared so far:
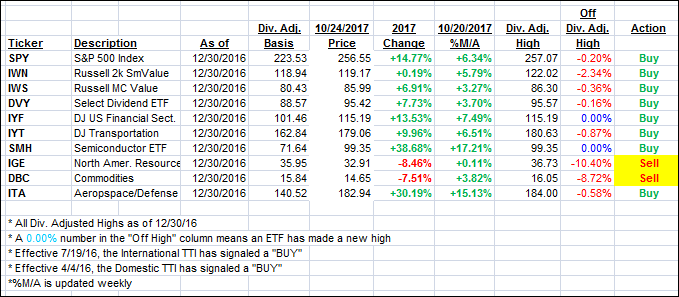
Again, the %M/A column above shows the position of the various ETFs in relation to their respective long term trend lines, while the trailing sell stops are being tracked in the “Off High” column. The “Action” column will signal a “Sell” once the -7.5% point has been taken out in the “Off High” column.
- Trend Tracking Indexes (TTIs)
Our Trend Tracking Indexes (TTIs) inched up a tad as only the Dow stood out in terms of performance.
Here’s how we closed 10/24/2017:
Domestic TTI: +2.79% (last close +2.73%)—Buy signal effective 4/4/2016
International TTI: +6.36% (last close +6.32%)—Buy signal effective 7/19/2016
Disclosure: I am obliged to inform you that I, as well as my advisory clients, own some of the ETFs listed in the above table. Furthermore, they do not represent a specific investment recommendation for you, they merely show which ETFs from the universe I track are falling within the guidelines specified.
Contact Ulli