
- Moving the Markets
Despite past warnings by the Fed that more interest hikes might be forthcoming, reality appears to show a different picture. As I have posted almost daily, the 10-year bond yield spiked and made its high for the year in early March at 2.62%, after which it zigzagged to a low of 2.05% earlier this month, and then started to rebound. Given that, it’s no surprise that traders anticipate ‘no change’ when the Fed announces its latest policies tomorrow. Much attention will be paid to the economic impacts of Hurricanes Irma and Harvey, the overall inflation picture and the Washington’s fiscal stimulus outlook.
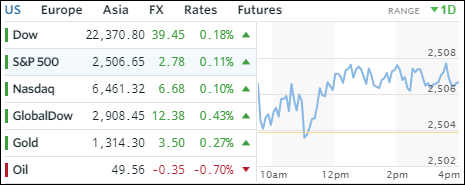
The major indexes inched higher led by Financials (XLF) with +0.68%. Aerospace & Defense benefited as well with ITA gaining +0.79%. In the equity ETF arena, International SmallCaps (SCHC) were the winner with a +0.53% advance. We saw MidCaps (SCHM) and Transportations (IYT) ending the day in the red with -0.20% and -0.06% respectively.
Treasury yields rose modestly ahead of the Fed’s announcement, Gold eked out a small gain, and the US Dollar index (UUP) resumed its slide after 2 up days by giving back -0.29%.
- ETFs in the Spotlight (updated for 2017)
In case you missed the announcement and description of this section, you can read it here again.
It features 10 broadly diversified and sector ETFs from my HighVolume list as posted every Saturday. Furthermore, they are screened for the lowest MaxDD% number meaning they have been showing better resistance to temporary sell offs than all others over the past year.
The below table simply demonstrates the magnitude with which some of the ETFs are fluctuating in regards to their positions above or below their respective individual trend lines (%M/A). A break below, represented by a negative number, shows weakness, while a break above, represented by a positive percentage, shows strength.
For hundreds of ETF choices, be sure to reference Thursday’s StatSheet.
Year to date, here’s how the 2017 candidates have fared so far:
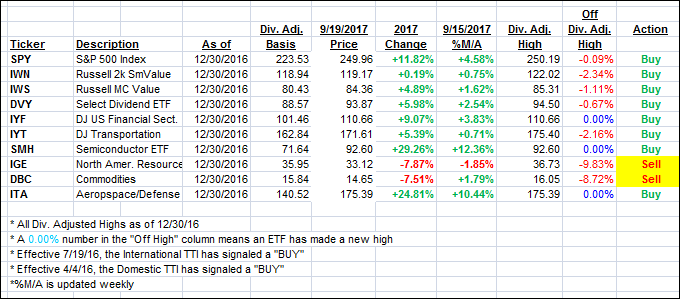
Again, the %M/A column above shows the position of the various ETFs in relation to their respective long term trend lines, while the trailing sell stops are being tracked in the “Off High” column. The “Action” column will signal a “Sell” once the -7.5% point has been taken out in the “Off High” column.
- Trend Tracking Indexes (TTIs)
Our Trend Tracking Indexes (TTIs) edged higher despite some anxiety before the Fed’s announcement tomorrow.
Here’s how we closed 9/19/2017:
Domestic TTI: +2.80% (last close +2.78%)—Buy signal effective 4/4/2016
International TTI: +7.37% (last close +7.07%)—Buy signal effective 7/19/2016
Disclosure: I am obliged to inform you that I, as well as my advisory clients, own some of the ETFs listed in the above table. Furthermore, they do not represent a specific investment recommendation for you, they merely show which ETFs from the universe I track are falling within the guidelines specified.
Contact Ulli