
- Moving the Markets
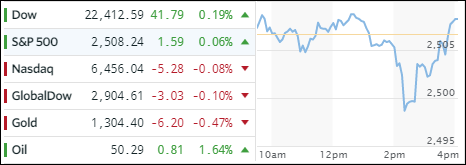
I had to laugh this morning when some news reports called the Nasdaq as having “plunged” in view of Apples weakness (-1.68%). It turned out that the Nasdaq merely retreated a meager -0.3% which appears to be, in that ‘new normal’ world we’re living in, quite a noteworthy drop. Go figure…
Of course, all eyes were on the Fed’s announcement about interest rates and the scaling back of the stimulus program. Indeed, they did come clean and projected the month of October to be starting point for the ‘great unwind’ of their massive $4.5 trillion balance sheet. However, they added that the reduction would be conducted “gradually and predictably,” at a rate of some $10 billion a month. They also signaled that a December rate hike may be still on the table.
As you can see from the above chart, the reaction was the usual one, namely a quick but modest sell-off followed by a rebound with only the Dow and S&P managing to climb back into the green and in the process setting new records. In ETF space, Transportations (IYT) came roaring back sporting a solid +1.48% gain. Aerospace & Defense (ITA) and MidCaps (SCHM) did well by adding +0.63% and 0.45% respectively. On the downside, our winner YTD, namely Semiconductors (SMH) lost -1.33%, while the International SmallCaps (SCHC) gave back a more modest -0.31%.
The yield on the 10-year bond rose by 1 basis point to end the session at 2.24%. Trading in a broad range was the US Dollar (UUP), which ended up +0.80% higher, however, it still hovers below its 50-day M/A and in bear market territory.
- ETFs in the Spotlight (updated for 2017)
In case you missed the announcement and description of this section, you can read it here again.
It features 10 broadly diversified and sector ETFs from my HighVolume list as posted every Saturday. Furthermore, they are screened for the lowest MaxDD% number meaning they have been showing better resistance to temporary sell offs than all others over the past year.
The below table simply demonstrates the magnitude with which some of the ETFs are fluctuating in regards to their positions above or below their respective individual trend lines (%M/A). A break below, represented by a negative number, shows weakness, while a break above, represented by a positive percentage, shows strength.
For hundreds of ETF choices, be sure to reference Thursday’s StatSheet.
Year to date, here’s how the 2017 candidates have fared so far:
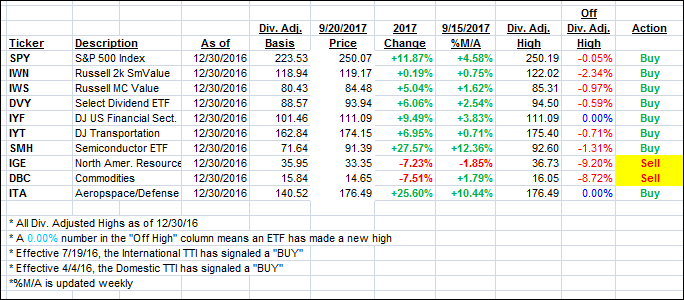
Again, the %M/A column above shows the position of the various ETFs in relation to their respective long term trend lines, while the trailing sell stops are being tracked in the “Off High” column. The “Action” column will signal a “Sell” once the -7.5% point has been taken out in the “Off High” column.
- Trend Tracking Indexes (TTIs)
Our Trend Tracking Indexes (TTIs) slipped immaterially as the major indexes remained in zig-zag mode.
Here’s how we closed 9/20/2017:
Domestic TTI: +2.79% (last close +2.80%)—Buy signal effective 4/4/2016
International TTI: +7.77% (last close +7.37%)—Buy signal effective 7/19/2016
Disclosure: I am obliged to inform you that I, as well as my advisory clients, own some of the ETFs listed in the above table. Furthermore, they do not represent a specific investment recommendation for you, they merely show which ETFs from the universe I track are falling within the guidelines specified.
Contact Ulli