
- Moving the Markets
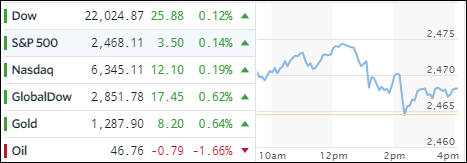
An early rally, ahead of the Fed minutes, fizzled after their release with the S&P 500 kissing its unchanged line before rebounding and ending up slightly in the green. The Dow and Nasdaq followed suit in similar fashion.
Contributing to some turmoil was President Trump’s decision to disband his advisory panel while political tensions were casting doubt on his pro-growth plans. Then it was the Fed’s turn as the minutes showed that the Central Bank is struggling with sluggish inflation, which could mean either limited or no rate hikes in the near future, while they remain eager to start unwinding their $4.5 trillion asset portfolio.
Across the ETF spectrum, domestic equities headed higher led by MidCaps (SCHM) with a gain of +0.35% followed by Dividend ETFs (SCHD) with +0.24%. Things looked better on the International side where the Emerging Markets (SCHE) took top billing with +1.19% followed by SmallCap International ETFs (SCHC) adding +0.67%.
The Fed’s dovish statement helped interest rates to fall allowing the 20-year bond (TLT) to rally +0.37%. The US dollar (UUP) traded in a broad range but closed lower by -0.33% wiping out the gains of the last two days.
- ETFs in the Spotlight (updated for 2017)
In case you missed the announcement and description of this section, you can read it here again.
It features 10 broadly diversified and sector ETFs from my HighVolume list as posted every Saturday. Furthermore, they are screened for the lowest MaxDD% number meaning they have been showing better resistance to temporary sell offs than all others over the past year.
The below table simply demonstrates the magnitude with which some of the ETFs are fluctuating in regards to their positions above or below their respective individual trend lines (%M/A). A break below, represented by a negative number, shows weakness, while a break above, represented by a positive percentage, shows strength.
For hundreds of ETF choices, be sure to reference Thursday’s StatSheet.
Year to date, here’s how the 2017 candidates have fared so far:
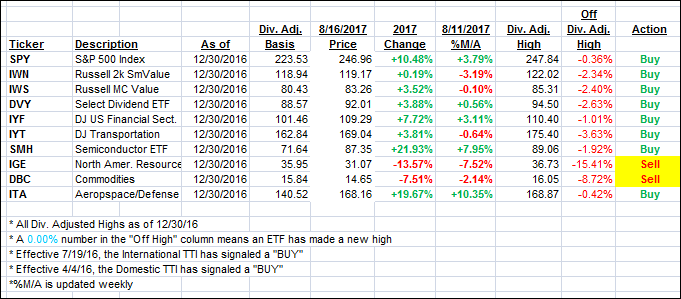
Again, the %M/A column above shows the position of the various ETFs in relation to their respective long term trend lines, while the trailing sell stops are being tracked in the “Off High” column. The “Action” column will signal a “Sell” once the -7.5% point has been taken out in the “Off High” column.
- Trend Tracking Indexes (TTIs)
Our Trend Tracking Indexes (TTIs) headed north with the International one taking a nice jump deeper into bullish territory.
Here’s how we closed 8/16/2017:
Domestic TTI: +2.92% (last close +2.77%)—Buy signal effective 4/4/2016
International TTI: +7.03% (last close +6.46%)—Buy signal effective 7/19/2016
Disclosure: I am obliged to inform you that I, as well as my advisory clients, own some of the ETFs listed in the above table. Furthermore, they do not represent a specific investment recommendation for you, they merely show which ETFs from the universe I track are falling within the guidelines specified.
Contact Ulli