
- Moving the Markets
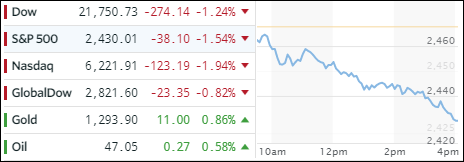
Not only did the Dow’s 4-day win streak come to an end today, all 3 major indexes showed the same pattern; that is slowly deteriorating momentum throughout the session and closing at the lows. There were no green numbers to be found only varying degrees of losses. Faring the best, were International SmallCaps (SCHC), which gave back only -0.64%. That was in stark contrast to the rest of the field where Transportations (IYT) fared the worst with -2.38% closely followed by Semiconductors (SMH) with -2.37%.
Contributing to this slide were a variety of events ranging from questions about Trump’s agenda to news of a terrorist attack in Spain and disappointing results from Cisco (-4.02%). Dismal Industrial Production data did not help either.
To no surprise, the S&P VIX rallied sharply and surged back to 15 reversing its recent drop. Benefiting from all this uncertainty was Gold, which continued its march towards the $1,300 milestone marker, a level which we have not seen since early last November. Interest rates dropped again with the 20-year Bond (TLT) rallying +0.75%. The US Dollar (UUP) traded in a tight range and managed to add +0.21% for the day.
Please see section 3 below for the effects on our Trend Tracking Indexes (TTIs).
- ETFs in the Spotlight (updated for 2017)
In case you missed the announcement and description of this section, you can read it here again.
It features 10 broadly diversified and sector ETFs from my HighVolume list as posted every Saturday. Furthermore, they are screened for the lowest MaxDD% number meaning they have been showing better resistance to temporary sell offs than all others over the past year.
The below table simply demonstrates the magnitude with which some of the ETFs are fluctuating in regards to their positions above or below their respective individual trend lines (%M/A). A break below, represented by a negative number, shows weakness, while a break above, represented by a positive percentage, shows strength.
For hundreds of ETF choices, be sure to reference Thursday’s StatSheet.
Year to date, here’s how the 2017 candidates have fared so far:
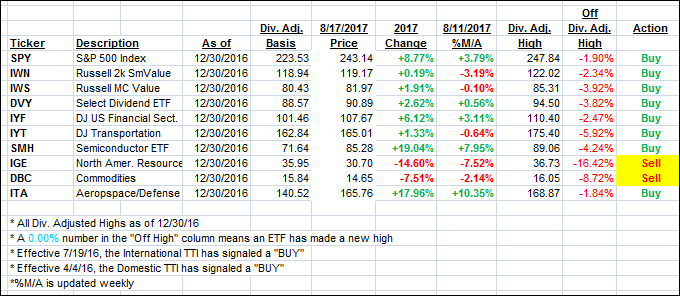
Again, the %M/A column above shows the position of the various ETFs in relation to their respective long term trend lines, while the trailing sell stops are being tracked in the “Off High” column. The “Action” column will signal a “Sell” once the -7.5% point has been taken out in the “Off High” column.
- Trend Tracking Indexes (TTIs)
Our Trend Tracking Indexes (TTIs) headed south as the bears were clearly in charge of today’s session.
Here’s how we closed 8/17/2017:
Domestic TTI: +2.28% (last close +2.92%)—Buy signal effective 4/4/2016
International TTI: +5.87% (last close +7.03%)—Buy signal effective 7/19/2016
Disclosure: I am obliged to inform you that I, as well as my advisory clients, own some of the ETFs listed in the above table. Furthermore, they do not represent a specific investment recommendation for you, they merely show which ETFs from the universe I track are falling within the guidelines specified.
Contact Ulli