
- Moving the Markets
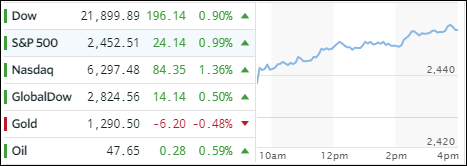
Some White House mumbling about Trump’s tax reform along with renewed war mongering from last night’s speech combined to provide the fuel to drive today’s rally enabling the Dow and S&P 500 to notch their best daily gain in some four months, but the Nasdaq was the session’s top performer with +1.36%.
Across our ETF holdings, we saw nothing but green numbers. Semiconductors (SMH) took top billing by gaining +1.34%, which was closely followed by LargeCaps (SCHX) with +1.02%. The low man on the “green” totem pole was International SmallCaps (SCHC) with +0.41%.
When we are in “risk-on” mode, safe havens will suffer and today was no exception. Bonds headed south, as yields rose, with the 20-year T-bond surrendering -0.39%. Gold joined in and gave back -0.48% as the US dollar (UUP) rose +0.41%.
Today represented a nice bounce off last Friday’s lows, but it’s too early to tell if this was just a short-term rebound within a longer term correction, or the resumption of the major uptrend.
- ETFs in the Spotlight (updated for 2017)
In case you missed the announcement and description of this section, you can read it here again.
It features 10 broadly diversified and sector ETFs from my HighVolume list as posted every Saturday. Furthermore, they are screened for the lowest MaxDD% number meaning they have been showing better resistance to temporary sell offs than all others over the past year.
The below table simply demonstrates the magnitude with which some of the ETFs are fluctuating in regards to their positions above or below their respective individual trend lines (%M/A). A break below, represented by a negative number, shows weakness, while a break above, represented by a positive percentage, shows strength.
For hundreds of ETF choices, be sure to reference Thursday’s StatSheet.
Year to date, here’s how the 2017 candidates have fared so far:
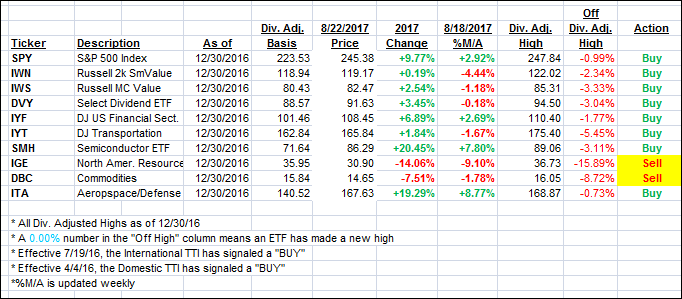
Again, the %M/A column above shows the position of the various ETFs in relation to their respective long term trend lines, while the trailing sell stops are being tracked in the “Off High” column. The “Action” column will signal a “Sell” once the -7.5% point has been taken out in the “Off High” column.
- Trend Tracking Indexes (TTIs)
Our Trend Tracking Indexes (TTIs) headed north as strong upward momentum supported the bullish case.
Here’s how we closed 8/22/2017:
Domestic TTI: +2.55% (last close +2.14%)—Buy signal effective 4/4/2016
International TTI: +6.27% (last close +5.63%)—Buy signal effective 7/19/2016
Disclosure: I am obliged to inform you that I, as well as my advisory clients, own some of the ETFs listed in the above table. Furthermore, they do not represent a specific investment recommendation for you, they merely show which ETFs from the universe I track are falling within the guidelines specified.
Contact Ulli