
- Moving the Markets
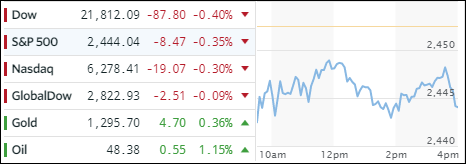
After yesterday’s euphoric rally, reality set in and pulled the indexes off their lofty levels. To be clear, the pullback was relatively benign compared to the gains. Contributing to the uneasiness was President Trump’s threat to shut down the government should congress continue to stonewall his efforts to build a wall along the Mexican border. In cased you don’t remember “the wall” was one of Trump’s campaign centerpieces.
All this demonstrates is how fragile the current environment is given that the upcoming debt ceiling debate looks to be a very contentious event. Of course, all this jawboning can’t hide the fact that in past years, a common ground was always found to make sure the limit to the US credit card was raised by a sufficient margin to continue reckless spending.
Across the ETF spectrum, there were more winners than losers. On the plus side, we saw Emerging Markets (SCHE) score a nice gain of +0.60%, while Semiconductors (SMH), despite the Nasdaq’s loss, closed in the green by +0.21%. On the losing side, Transportations (IYT) fared the worst with -1.33%, followed by the Dividend ETF (SCHD) with -0.35%.
Gold and bonds rallied in sync with gold adding +0.36% but still remaining below its $1,300 level. As yields dropped, the 20-year bond advanced and gained +0.68%, which is its highest level since late June. Bucking the trend was the US dollar (UUP) as it lost -0.41% for the day and -9.9% YTD.
- ETFs in the Spotlight (updated for 2017)
In case you missed the announcement and description of this section, you can read it here again.
It features 10 broadly diversified and sector ETFs from my HighVolume list as posted every Saturday. Furthermore, they are screened for the lowest MaxDD% number meaning they have been showing better resistance to temporary sell offs than all others over the past year.
The below table simply demonstrates the magnitude with which some of the ETFs are fluctuating in regards to their positions above or below their respective individual trend lines (%M/A). A break below, represented by a negative number, shows weakness, while a break above, represented by a positive percentage, shows strength.
For hundreds of ETF choices, be sure to reference Thursday’s StatSheet.
Year to date, here’s how the 2017 candidates have fared so far:
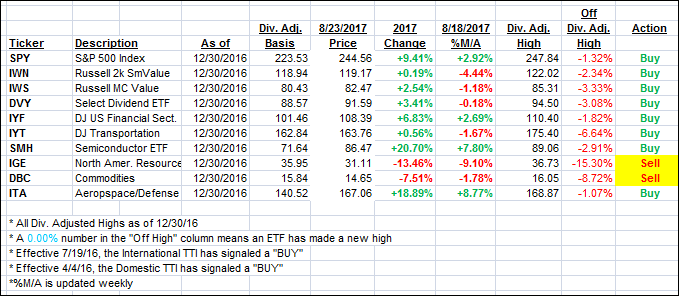
Again, the %M/A column above shows the position of the various ETFs in relation to their respective long term trend lines, while the trailing sell stops are being tracked in the “Off High” column. The “Action” column will signal a “Sell” once the -7.5% point has been taken out in the “Off High” column.
- Trend Tracking Indexes (TTIs)
Our Trend Tracking Indexes (TTIs) retreated as the major indexes pulled back.
Here’s how we closed 8/23/2017:
Domestic TTI: +2.41% (last close +2.55%)—Buy signal effective 4/4/2016
International TTI: +6.16% (last close +6.27%)—Buy signal effective 7/19/2016
Disclosure: I am obliged to inform you that I, as well as my advisory clients, own some of the ETFs listed in the above table. Furthermore, they do not represent a specific investment recommendation for you, they merely show which ETFs from the universe I track are falling within the guidelines specified.
Contact Ulli